You're viewing **Apigee Edge** documentation.
[Go to the
**Apigee X** documentation](http://cloud.google.com/apigee/docs/api-platform/analytics/traffic-composition-dashboard). info
## What does this dashboard tell me?
The Traffic Composition dashboard measures the relative contribution of your top APIs, apps,
developers, and products to your overall API program.
Use the report to detect business problems such as lower traffic trends or diminishing
contribution from key apps and developers. Based on this data, you can decide what corrective
action to take. You can also get early notification of new entities that contribute to API
traffic, and take actions to respond --- for example, you can determine which new developers
are highly contributing and include them in nurturing programs.
> [!NOTE]
> **Note:** The Traffic Composition dashboard requires data range queries to be more than a month (for example, November 30 to December 31). Queries over less than a month return an empty page (for example, December 1 to December 31).
> [!NOTE]
> **Note:** **Data delay interval**
> After API calls are made to proxies, it may take up to **13 minutes** for the data to appear in dashboards, custom reports, and management API calls.
## The Traffic Composition dashboard
Access the Traffic Composition dashboard, as described below.
### Edge
To access the Traffic Composition dashboard using the Edge UI:
1. Sign in to .
2. Select **Analyze \> Developers \> Traffic Composition**.
### New Edge UI (Private Cloud)
> [!NOTE]
> **Note:** The New Edge UI is available with Edge for Private Cloud only.
To access the Traffic Composition dashboard using the New Edge UI:
1. Sign in to the New Edge UI at `http://host:3001/edge`, where host is the IP address or DNS name of the host running the New Edge UI.
2. Select **Analyze \> Developers \> Traffic Composition**.
The dashboard opens as shown below:
## What does this dashboard measure?
This dashboard has two measurement modes, which you select with the **Overview**
and **By Dimension** buttons:
| Mode | Description |
|---|---|
| Overview | Gives you a quick glance at traffic patterns for proxies, developer apps, products, and developers. For example, use this view to see which proxy, app, product, or developer is generating the most traffic. |
| By Dimension | Let's you drill in to see a more detailed view of proxy, developer app, product, and developer traffic. |
> [!NOTE]
> **Note:** Seeing a dimension entity named ***na*** ? For more information, see [What does an analytics entity named "na" mean?](https://docs.apigee.com/api-platform/analytics/why-am-i-seeing-analytics-entity-named-not-set).
### What the Overview mode tells
you
Click **Overview** to display this mode. This mode presents a set of
straight-forward graphs showing traffic patterns proxies, developer apps, developers, and
products.
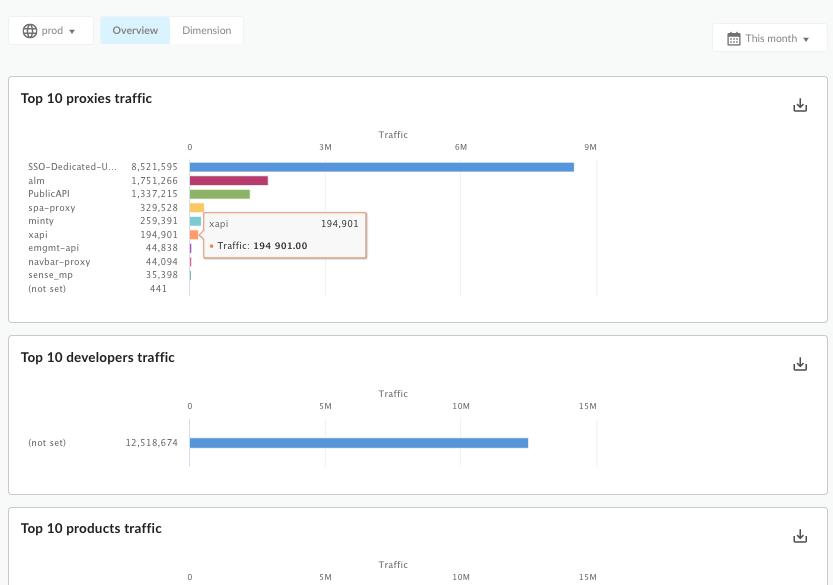
The following figure shows part of the traffic composition overview page:
| Mode | Description |
|---|---|
| Top 10 Proxies Traffic | Shows the top 10 proxies measured by API traffic. |
| Top 10 Developers Traffic | Shows the top 10 developers measured by API traffic. |
| Top 10 Products Traffic | Shows the top 10 products measured by API traffic. |
| Top 10 Apps Traffic | Shows the top 10 developer apps measured by API traffic. |
### What the By Dimension mode
tells you
Click **By Dimension** to display this mode. This mode lets you drill in to see
traffic pattern details for **specific** proxies, developer apps, developers, and
products. For example, you can see at a glance how traffic for a specific proxy compares to all
other proxies.
1. Select a dimension to examine. Dimensions include:
- Developer Apps
- Developers
- Products
- Proxies
2. Select the dimension instance to examine. For example, if the dimension is
**Developers** , select a developer from the dropdown list, or select
**All** to see metrics on all developers.
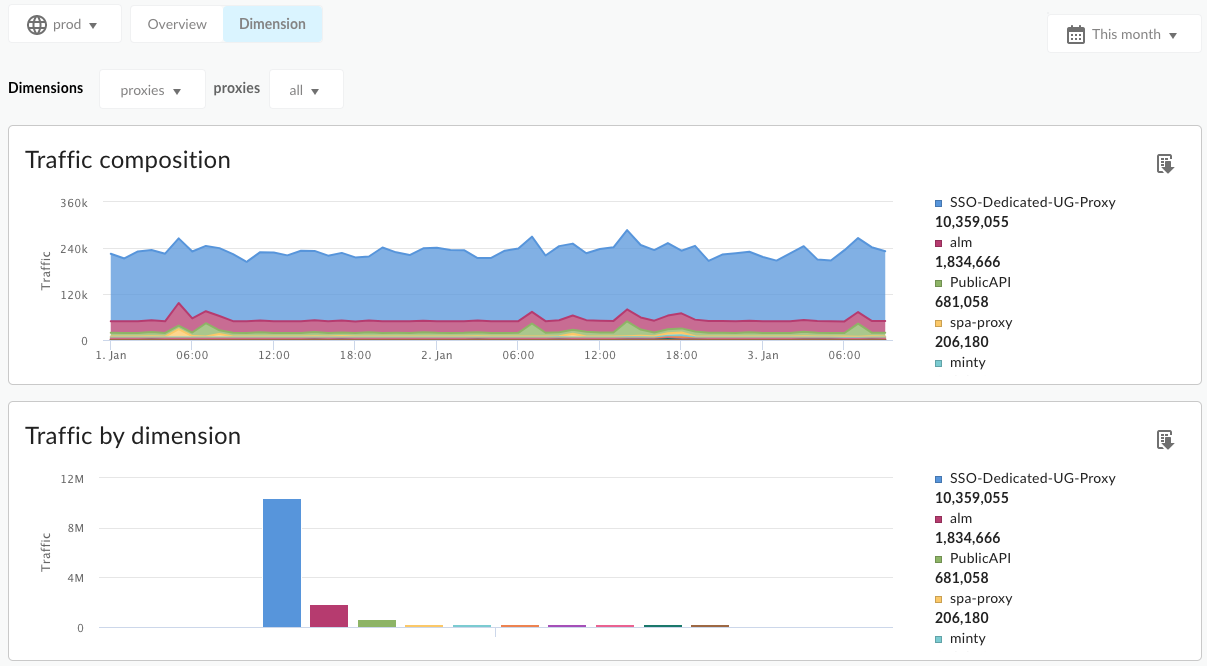
If you select **All** for a dimension, the dashboard offers charts that compare
all entities together. For example, the Traffic by Dimension chart compares API proxy traffic for
all API proxies in the organization.
Charts you will see in this mode include:
- [Traffic composition](https://docs.apigee.com/api-platform/analytics/traffic-composition-dashboard#trafficcomposition)
- [Traffic by dimension](https://docs.apigee.com/api-platform/analytics/traffic-composition-dashboard#trafficbydimension)
- [Top 10 monthly composition](https://docs.apigee.com/api-platform/analytics/traffic-composition-dashboard#top10monthlycomp)
#### Traffic Composition
Shows the traffic for all entities of the selected dimension or all entities combined over the
selected time interval.
| Mode | Description |
|---|---|
| All Dimensions Traffic | Shows the traffic for all of the selected dimension in one chart. Dimensions can include API proxies, developer apps, developers, or products. |
| Proxy-specific traffic | Shows the traffic for the selected dimension. |
#### Top 10 Monthly Composition
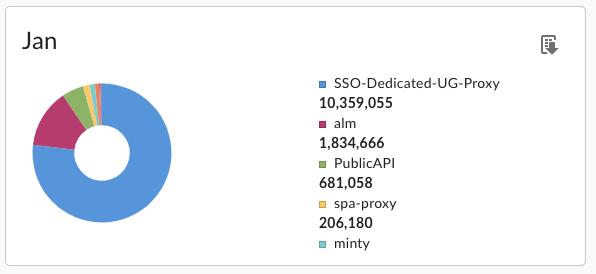
This view's pie charts let you quickly compare traffic patterns for all of your proxies,
developer apps, products, or developers.
## What else do I need to know about this
dashboard?
This dashboard uses standard controls, like the date and data aggregation selectors, hovering
over graphs for more context, exporting data to CSV, and so on. To learn more, see
[Using the analytics dashboards](https://docs.apigee.com/api-platform/analytics/using-analytics-dashboards).