You're viewing **Apigee Edge** documentation.
[Go to the
**Apigee X** documentation](http://cloud.google.com/apigee/docs/api-platform/analytics/using-analytics-dashboards). info
Analytics dashboards help you see and detect changes in your API ecosystem at a glance. The
ability to see what has changed over time helps you identify problems and take corrective action
quickly.
> [!IMPORTANT]
> This product includes GeoLite Data created by MaxMind, available from [https://www.maxmind.com](https://www.maxmind.com/).
For a quick overview of Edge API Analytics, who uses them, and why, see
[API Analytics overview](https://docs.apigee.com/api-platform/analytics/analytics-services-overview).
For a quick overview of the analytics dashboards, watch this video.
> [!NOTE]
> **Note:** There is a limit to the amount of data that can be reported in
> the Analytics dashboards. If the amount of analytics data returned by the query exceeds this
> limit, then the dashboard will display the results for a partial set of data and a warning will
> be displayed on the dashboard (Public Cloud only).
>
> As an alternative, you can export analytics data from Apigee Analytics to your own data repository,
> such as Google Cloud Storage or BigQuery. You can then take advantage of the powerful query and machine
> learning capabilities offered by Google Cloud BigQuery and TensorFlow to perform your own data analysis.
> See [Export data from Analytics](https://docs.apigee.com/api-platform/analytics/export-data) for more.
## What can you learn from the dashboards?
Has there been a sudden spike or drop off in API traffic? Which app developers are most
successful? What is the adoption rate of your API among developers? Which API methods are most
popular? The Edge Analytics dashboards are designed specifically to answer questions like
these.
In the background, Apigee Edge collects information as data passes through your APIs. The
dashboards provide a powerful way to use this data immediately. If you see something of interest
in a graph or chart, an anomaly or sudden change, you can then drill deeper to uncover as much
detail as you require. If you notice that a particular developer is experiencing a lot of errors
or a sudden drop in traffic, you can contact that developer proactively. Dashboards give you
insight into your APIs that allows you to take action.
## What's the delay interval for receiving data?
> [!NOTE]
> **Note:** **Data delay interval**
> After API calls are made to proxies, it may take up to **13 minutes** for the data to appear in dashboards, custom reports, and management API calls.
## Can I customize the dashboards?
Yes, many dashboards let you select which metrics to analyze, date ranges, data aggregation
intervals, and many other variables. If the built-in dashboards do not suit your needs, you can
create [custom reports](https://docs.apigee.com/api-platform/analytics/create-custom-reports), which are dashboards you create by
selecting the analytic dimensions and metrics that you wish to analyze. Custom reports let you
"drill down" into your API's analytic data until you achieve the granularity you require.
## What are the most common features in the dashboards?
Dashboards have a set of common features, including setting time range, click and drag zooming on charts,
mouse-over hover for more details on charts and other regions, and selectors for choosing the data
to display in a chart. If you understand how to use one kind of dashboard, you'll be comfortable using the others.
> [!NOTE]
> **Note:**For the specific features of each dashboard, view the documentation for that dashboard.
The following figure highlights these common feature areas:
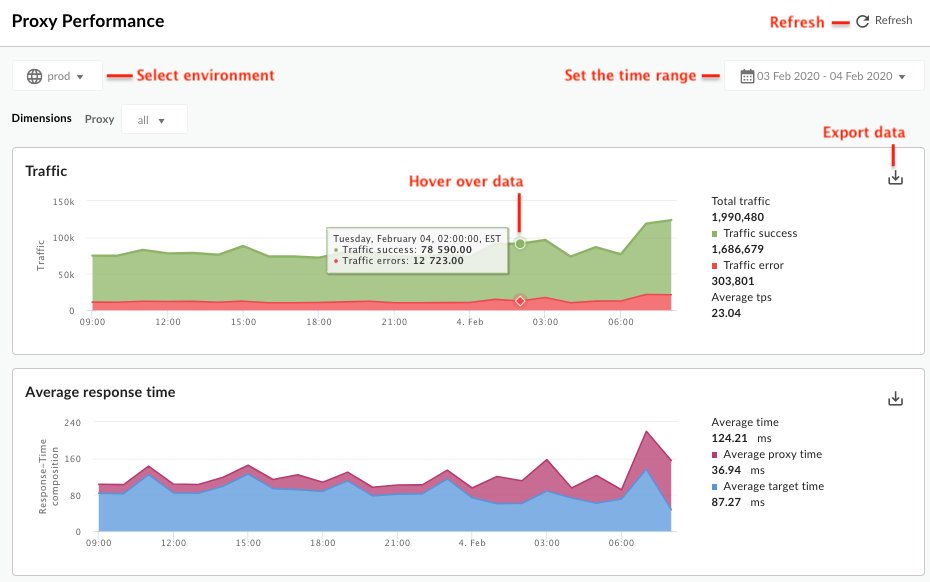
- **Set the time range** - Set the time range over which the dashboard
displays its data.
> [!NOTE]
> **Note:** For Cloud-based installations, data older than six months from the current date is not accessible by default. If you want to access data older than six months, contact [Apigee Edge Support](https://docs.apigee.com/api-platform/troubleshoot/support).
>
> For Private Cloud installations, the maximum time frame for running custom reports
> through the UI is 14 days. To increase that to 183 days (six months),
> see [Allow longer custom reports in the Edge UI](https://docs.apigee.com/private-cloud/latest/allow-long-custom-reports).
- **Refresh** - Refresh the dashboard data.
- **Environment** - Select the environment in the organization.
- **Zoom in** - You can zoom in on chart data by clicking and dragging a region of the chart. When you complete the drag, the chart zooms in to the selected region.
- **Export data to file** - Download a single CSV file that contains the set of data for the chart.
- **Hover mouse over graphs** - You can mouse over any point on a graph for more context about the data at that point.
## Reading dispersion box plots
When an analytics report illustrates an average, as well as minimum and maximum values, it
display an accompanying dispersion box plot, as shown in the custom report below:

At a glance, a dispersion box plot enables you to see the central tendency and dispersion of
your data. A dispersion box plot surfaces the five key numbers when it comes to illustrating
averaged analytics data:
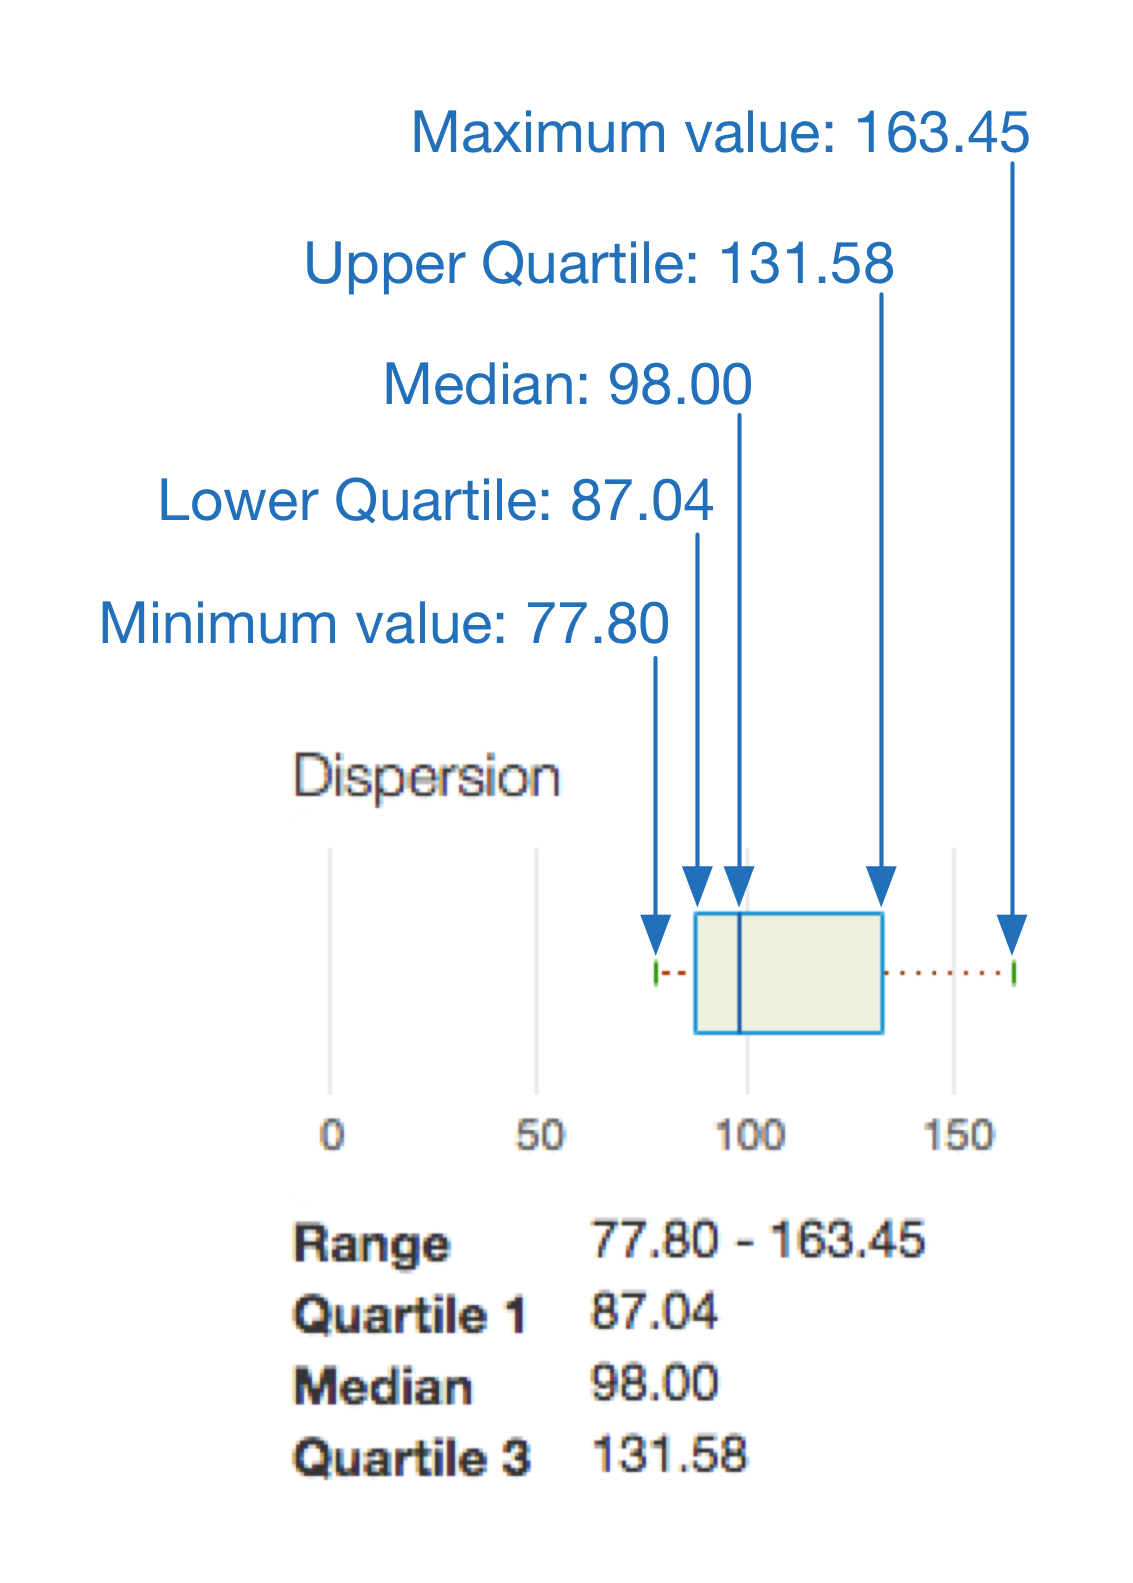
In this example:
- The area within the box indicates the most typical average target response times experienced by your traffic --- 50% of your traffic, to be exact.
- The line extending from the left side of the box indicates the average target response times experienced by 25% of your traffic.
- The line extending from the right of the box indicates the average target response times experienced by the remaining 25% of your traffic. The longer these lines, or "whiskers," the more extreme your outlier values.