You're viewing **Apigee Edge** documentation.
[Go to the
**Apigee X** documentation](http://cloud.google.com/apigee/docs/api-platform/errorcatalog/mp-runtime-errorcatalog). info
> [!NOTE]
> **Note:** Was this troubleshooting playbook helpful? Please let us know by clicking [Send Feedback]().
## Symptom
The client application receives an HTTP status code of `504` with the message
`Gateway Timeout` in response to API calls.
This error response indicates that the client did not receive a timely response from Apigee Edge
or the backend server during the execution of an API call.
## Error message
Client application gets the following response code:
```
HTTP/1.1 504 Gateway Time-out
```
When calling such proxy using cURL or a web browser, you might get the following error:
```
Error
An error occurred.
Sorry, the page you are looking for is currently unavailable.
Please try again later.
```
## What causes timeouts?
The typical path for an API request via the Edge platform is **Client \> Router \> Message
Processor \> Backend Server** as shown in the following figure:

All the components in the Apigee Edge runtime flow including clients, Routers, Message
Processors and backend servers are set up with suitable default timeout values in order to
ensure that the API requests don't take too long to complete. If any of the components in the
flow don't get the response from the upstream component within the time period specified in the
timeout configuration, then the specific component will timeout and will usually return a
`504 Gateway Timeout`error.
This playbook describes how to troubleshoot and resolve a `504` error caused when
the Router times out.
> [!NOTE]
> **Note:** Generally when Router times out, you will see the error in HTML format as shown above.
### Timeout on Router
The default timeout configured on Routers in Apigee Edge is 57 seconds. This is the maximum
amount of time an API proxy can execute from the time the API request is received on Edge until
the response is sent back, including the backend response and all policies that are executed.
The default timeout can be overridden on the Routers/virtual hosts as explained in
[Configuring I/O timeout on Routers](https://docs.apigee.com/how-to-guides/configuring-io-timeout-routers).
### Possible causes
In Edge, the typical causes for the `504 Gateway Timeout` error caused due to the
Router timing out are:
| Cause | Description | Troubleshooting instructions applicable for |
|---|---|---|
| [Incorrect timeout configuration on Router](https://docs.apigee.com/api-platform/troubleshoot/runtime/504-gateway-timeout-router-timing-out#incorrect-to-router) | This happens if the Router is configured with incorrect I/O timeout period. | Edge Public and Private Cloud users |
## Common diagnosis steps
Use one of the following tools/techniques to diagnose this error:
- API monitoring
- NGINX access logs
### API monitoring
**Note:** The instructions in this section are applicable only for Edge Public Cloud users.
To diagnose the error using API Monitoring:
1. Navigate to the **Analyze \> API Monitoring \> Investigate** page.
2. Filter for `5xx` errors and select the timeframe.
3. Plot **Status Code** against **Time**.
4.
Click the specific cell showing `504` errors to see more details and view
logs about these errors as shown below:
**Example showing 504 Errors**

5. In the right hand pane, click **View logs** .

From the **Traffic Logs** window, note the following details for some `504` errors:
- **Request:** This provides the request method and URI used for making the calls
- **Response** **Time:** This provides the total time elapsed for the request.
In the example above,
- **Request** is pointing to `GET /test-timeout`.
- **Response Time** is `57.001` seconds. This indicates that the Router has timed out before the Message Processor could respond back as the value is very close to the default I/O timeout set on the Router, which is**57
seconds.**
You can also get all of the logs by using the API Monitoring
[GET logs](https://apidocs.apigee.com/docs/logs/1/routes/logs/get) API.
For example, by querying logs for `org`, `env`, `timeRange`,
and `status`, you would be able to download all the logs for transactions where
the client timed out.
Since API Monitoring sets the proxy to `-` (not set) for these `504`
errors, you can use the API ([Logs
API](https://apidocs.apigee.com/docs/logs/1/overview)) to get the associated proxy for the virtual host and path.
For example :
```
curl "https://apimonitoring.enterprise.apigee.com/logs/apiproxies?org=ORG&env=ENV&select=https
```
> [!NOTE]
> **Note:** The following fields will display the value - for this `504` error:
> - Fault Source
> - Fault Code
> - Fault Flow
> - Fault Policy
> - Fault Proxy
>
>
> These fields are populated by the Message Processor and will be set with appropriate values
> only if the Router receives a response from the Message Processor. In this case, the Router
> has timed out ahead of the Message Processor as it did not respond back in a timely manner.
> This forces the Router to set the status code to `504` and as a result all of the
> above mentioned fields display as `-`.
6. Review the **Response Time** for additional `504` errors and check to see if the **Response Time** is consistent (I/O timeout value set on the Router which is 57 seconds) across all of the `504` errors.
### NGINX access logs
> [!NOTE]
> **Note:** The instructions in this section are applicable only for Edge Private Cloud users.
To diagnose the error using NGINX access logs:
1. Check the NGINX access logs:
`/opt/apigee/var/log/edge-router/nginx/ORG~ENV.PORT#_access_log`
2. Search to see if there are any `504` Errors during a specific duration (if the problem happened in the past) or if there are any requests still failing with `504`.
3. Note the following information for some `504` errors:
- Response Time
- Request URI

In this example, we see the following information:
-
**Request Time:** `57.001` seconds. This indicates that the
Router timed out after **57.001** seconds.
> [!NOTE]
> **Note:** This represents the field `request_time` in NGINX logs. It means the request processing time in seconds; time elapsed between the first bytes were read from the client and the log write after the last bytes were sent to the client.
- **Request:** `GET /test-timeout`
- **Host Alias** : `myorg-test.apigee.net`
> [!NOTE]
>
> **Note:** The following fields will display the value `-` for this `504`
> error:
> - Fault Source
> - Fault Code
> - Fault Flow
> - Fault Policy
> - Fault Proxy
>
>
> These fields are populated by the Message Processor and will be set with appropriate values only
> if the Router receives a response from the Message Processor. In this case, the Router has timed
> out ahead of the Message Processor as it did not respond back in a timely manner. This forces
> the Router to set the status code to `504` and as a result all of the above mentioned
> fields display as `-`.
4.
Check to see if the **Request Time** is the same as the I/O timeout
configured on the Router/virtual host. If yes, then it means the Router timed out before the
Message Processor did not respond within this period.
In the example NGINX Access Log entry shown above, the **Request
Time** of `57.001` seconds is very close to the default I/O timeout set
on the Router. This clearly indicates that the Router timed out before the Message
Processor could respond back.
5. Determine the API Proxy for which the request was made by using the base path in the **Request**field.
## Cause: Incorrect timeout configuration on Router
### Diagnosis
1. Determine if the `504` errors are caused because the Router has timed out before the Message Processor could respond back. You can do this by checking to see if the **Response Time** in API Monitoring/**Request Time** in the Router (both fields represent the same information,but are called by different names) is the same as the I/O timeout configured on Router/virtual host and the fields **Fault Source** , **Fault
Proxy** and **Fault Code** are set to `-` using API Monitoring or NGINX Access logs as explained in [Common diagnosis steps](https://docs.apigee.com/api-platform/troubleshoot/runtime/504-gateway-timeout-router-timing-out#common-diagnosis-steps).
2.
Check to see if the I/O timeout value configured on the Router or specific virtual host is
*lower* compared to that configured on the Message Processor or the specific API Proxy.
You can do this by following the steps in this section.
#### Verifying I/O timeout on virtual hosts
> [!NOTE]
> **Note:** The instructions in this section are applicable for both Public and Private Cloud users
##### Edge UI
To verify the virtual host timeout using the Edge UI, do the following:
1. Login to Edge UI.
2. Navigate to **Admin \> Virtual Hosts**.
3. Select a specific **Environment** where you are experiencing the timeout issue.
4. Select the specific virtual host for which you would like to verify the I/O timeout value.
5. Under **Properties** , view the **Proxy Read Timeout** value in seconds.
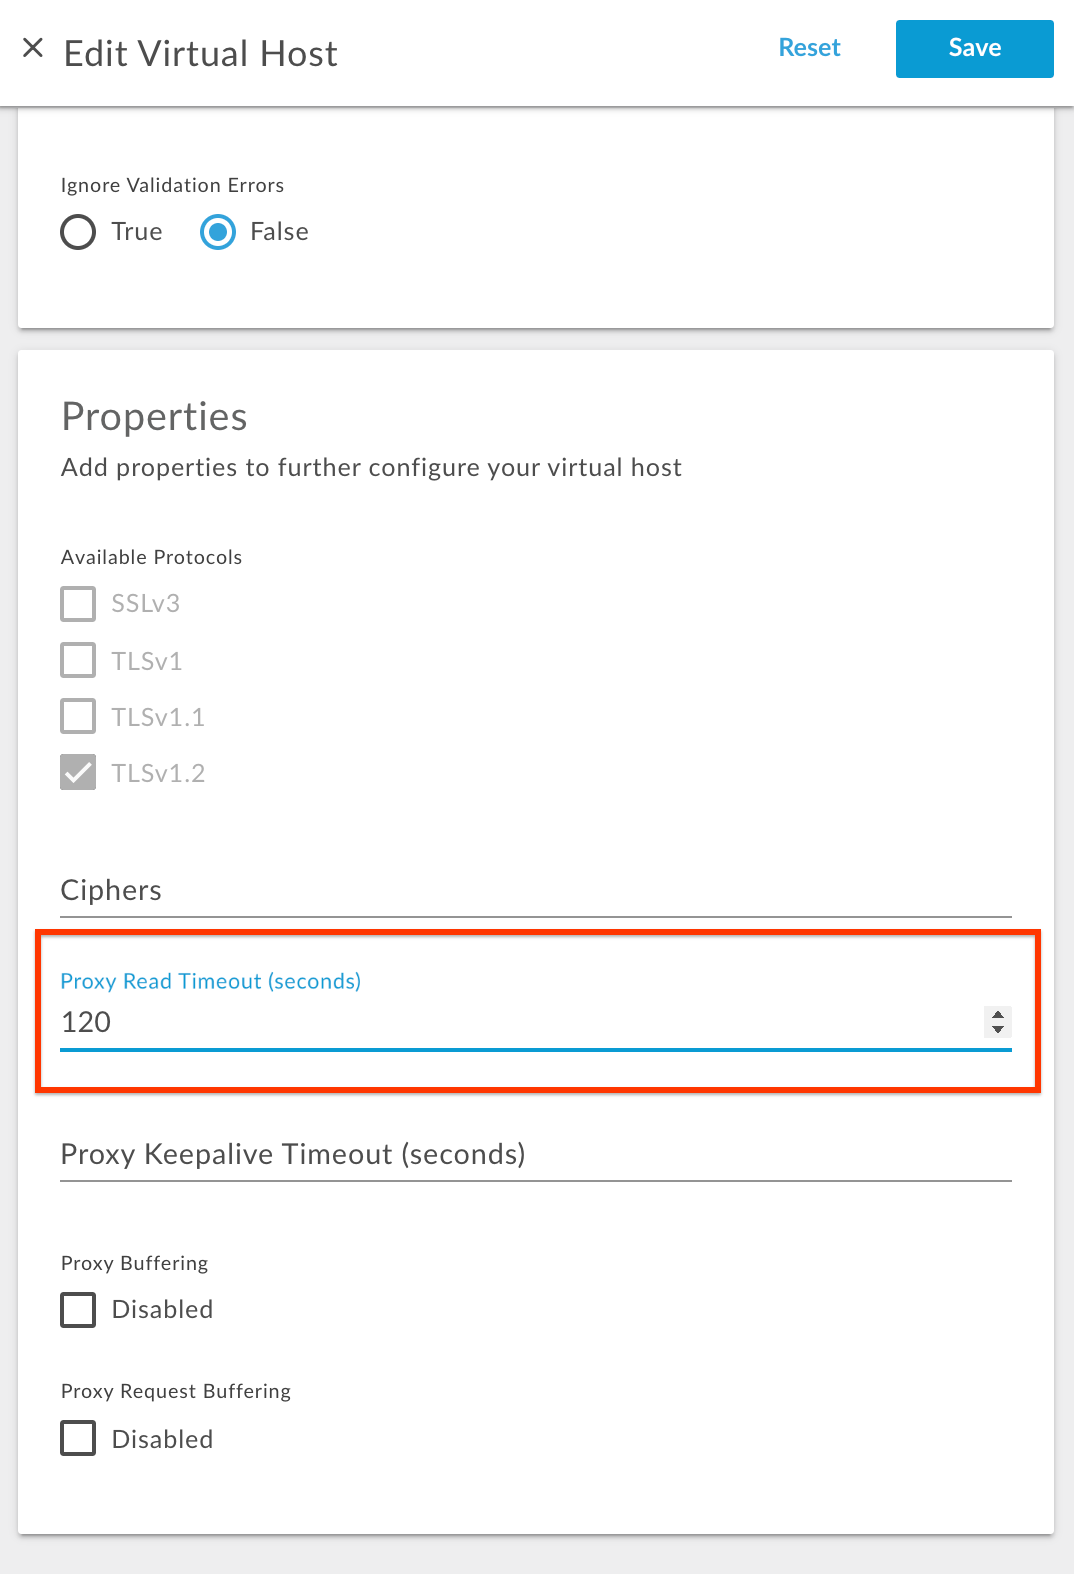
In the above example, the **Proxy Read Timeout** is configured with a value of
`120`. This means that the I/O timeout configured on this virtual host is 120 seconds.
> [!NOTE]
> **Note:** If the **Proxy Read Timeout** does not have any value, that means that it will take the **default value of 57 seconds**configured on the Router (unless the I/O timeout is overridden on the Router instances).
##### Management APIs
You can also verify the **Proxy Read Timeout** using the following management APIs:
1.
Execute the
[Get virtual host](https://apidocs.apigee.com/docs/virtual-hosts/1/routes/organizations/%7Borg_name%7D/environments/%7Benv_name%7D/virtualhosts/%7Bvirtualhost_name%7D/get) API to get the `virtualhost` configuration as shown below:
**Public Cloud user**
```
curl -v -X GET https://api.enterprise.apigee.com/v1/organizations/ORGANIZATION_NAME/environments/ENVIRONMENT_NAME/virtualhosts/VIRTUALHOST_NAME -u USERNAME
```
**Private Cloud user**
```
curl -v -X GET http://MANAGEMENT_SERVER_HOST:PORT#/v1/organizations/ORGANIZATION_NAME/environments/v/virtualhosts/VIRTUALHOST_NAME -u USERNAME
```
Where:
ORGANIZATION_NAME is the name of the organization
ENVIRONMENT_NAME is the name of the environment
VIRTUALHOST_NAME is the name of the virtual host
2. Check the value configured for the property `proxy_read_timeout`
**Sample Virtual Host Definition**
```
{
"hostAliases": [
"api.myCompany,com",
],
"interfaces": [],
"listenOptions": [],
"name": "secure",
"port": "443",
"retryOptions": [],
"properties": {
"property": [
{
"name": "proxy_read_timeout",
"value": "120"
}
]
},
"sSLInfo": {
"ciphers": [],
"clientAuthEnabled": "false",
"enabled": "true",
"ignoreValidationErrors": false,
"keyAlias": "myCompanyKeyAlias",
"keyStore": "ref://myCompanyKeystoreref",
"protocols": []
},
"useBuiltInFreeTrialCert": false
}
```
In the above example, `proxy_read_timeout` is configured with a value of
`120`. This means that the I/O timeout configured on this virtual host is 120
seconds.
> [!NOTE]
> **Note:** If the property `proxy_read_timeout` does not exist in the output of the management API, then that means that it will take the default value of 57 seconds (unless the I/O timeout is overridden on the Router instances).
#### Verifying I/O timeout on router.properties file
> [!NOTE]
> **Note:** The instructions in this section are applicable only for Edge Private Cloud users.
1. Login to a Router machine.
2. Search for the property `proxy_read_timeout` in the `/opt/nginx/conf.d` directory and check to see if it has been set with the new value as follows:
```
grep -ri "proxy_read_timeout" /opt/nginx/conf.d
```
3.
Check the value set for the property `proxy_read_timeout` in the specific virtual
host configuration file.
**Sample result from grep command**
```
/opt/nginx/conf.d/0-default.conf:proxy_read_timeout 57;
/opt/nginx/conf.d/0-edge-health.conf:proxy_read_timeout 1s;
```
In the example output above, notice that the property `proxy_read_timeout` has
been set with the new value `57` in `0-default.conf` which is the
configuration file for the default virtual host. This indicates that the I/O timeout is
configured to 57 seconds on the Router for the *default* virtual host. If you have
multiple virtual hosts, you will see this information for each of them. Get the value of
`proxy_read_timeout` for the specific virtual host you used for making the API
calls that failed with `504` errors.
#### Verifying I/O timeout in API proxy
You can view the I/O timeout in the following:
- Target endpoint of API proxy
- ServiceCallout policy of API proxy
##### View I/O timeout in target endpoint of API proxy
1. In the Edge UI, select the specific API proxy in which you would like to view the I/O timeout value.
2. Select the specific target endpoint that you want to check.
3. See the property `io.timeout.millis` with an appropriate value under the `` element in the `TargetEndpoint` configuration.
For example, the I/O timeout in the following code is set to 120 seconds:
```
120000
```
##### View I/O timeout in ServiceCallout policy of API proxy
1. In the Edge UI, select the specific API proxy in which you would like to view the new I/O timeout value for the ServiceCallout policy.
2. Select the specific ServiceCallout policy that you want to check.
3.
See the element `` with an appropriate value under the
`` configuration.
For example, the I/O timeout of the following code will be 120 seconds:
```
120000
```
#### Verifying I/O timeout on the Message Processors
> [!NOTE]
> **Note:** The instructions in this section are applicable only for Edge Private Cloud users.
1. Login to the Message Processor machine.
2.
Search for the property `HTTPTransport.io.timeout.millis` in the
`/opt/apigee/edge-message-processor/conf` directory using the following command:
```
grep -ri "HTTPTransport.io.timeout.millis" /opt/apigee/edge-message-processor/conf
```
**Sample output**
```
/opt/apigee/edge-message-processor/conf/http.properties:HTTPTransport.io.timeout.millis=55000
```
3. In the example output above, notice that the property `HTTPTransport.io.timeout.millis` has been set with the value `55000` in `http.properties`. This indicates that the I/O timeout is successfully configured to 55 seconds on the Message Processor.
Once you've determined the timeout configured on the Router and Message Processor, verify if the
Router/virtual host has been configured with a lower timeout value compared to that on the
Message Processor/API proxy.
Make a note of the values set on all the layers as shown in the below table:
| Timeout on Router (seconds) | Timeout on virtual host (seconds) | Timeout on Message Processor (seconds) | Timeout on API proxy (seconds) |
|---|---|---|---|
| 57 | - | 55 | 120 |
In this example,
- The default value of 57 seconds is configured on the Router.
- The timeout value is not set on the specific virtual host. This means that it will use the default value of 57 seconds configured on the Router itself.
- On the Message Processor, a default value of 55 seconds is configured.
- However, on the specific API Proxy, a value of 120 seconds is configured.
Note that the higher timeout value is configured only on the API proxy, but the Router is still
configured with 57 seconds. Hence, the Router times out at 57 seconds while the Message
Processor/backend is still processing your request. This causes the Router to respond back with
`504 Gateway Timeout` error to the client application.
### Resolution
Perform the following steps to configure the proper I/O timeout on the Router and Message
Processor to resolve this issue.
1. Refer to [Best practices for configuring I/O timeout](https://docs.apigee.com/how-to-guides/configuring-io-timeout-best-practices) to understand what timeout values should be set on different components involved in the API request flow through Apigee Edge.
2. In the above example, if you ascertain that a higher timeout value needs to be set because the backend server requires a longer time, and you've increased the timeout value of the Message Processor to 120 seconds, then set a higher timeout value For example: `123 seconds` on the Router. To avoid impacting all the API Proxies due to the new timeout value, set the value of `123 seconds` only *on the specific virtual host* that is used in the specific API Proxy.
3. Follow the instructions in [Configuring I/O timeout on Routers](https://docs.apigee.com/how-to-guides/configuring-io-timeout-routers) to set the timeout on the virtual host.