
You're viewing Apigee Edge documentation.
Go to the
Apigee X documentation. info
What you'll learn
Through this tutorial, you'll learn to:
- See the response message's headers and body content.
- See error messages.
What you'll need
- At least one policy in your proxy (also part of the Get Started tutorial).
curlinstalled on your machine to make API calls from the command line.
View message data
The API proxy Trace tool lets you view headers, variables, objects, and other details such as response time in the API proxy request and response flow. The Trace tool also lets you see how a request or response changes as it is processed by an API proxy.
In the previous tutorial, you restricted the number of requests with the SpikeArrest policy. Now, you'll use the Trace tool to see interesting details when that rate is exceeded.
- On the Develop tab of the API proxy, edit the Spike Arrest policy's
<Rate>to be 1pm again, then Save the proxy. This will allow us to see both successful and failed (over the limit) API calls. - In the API proxy editor, click the Trace tab.
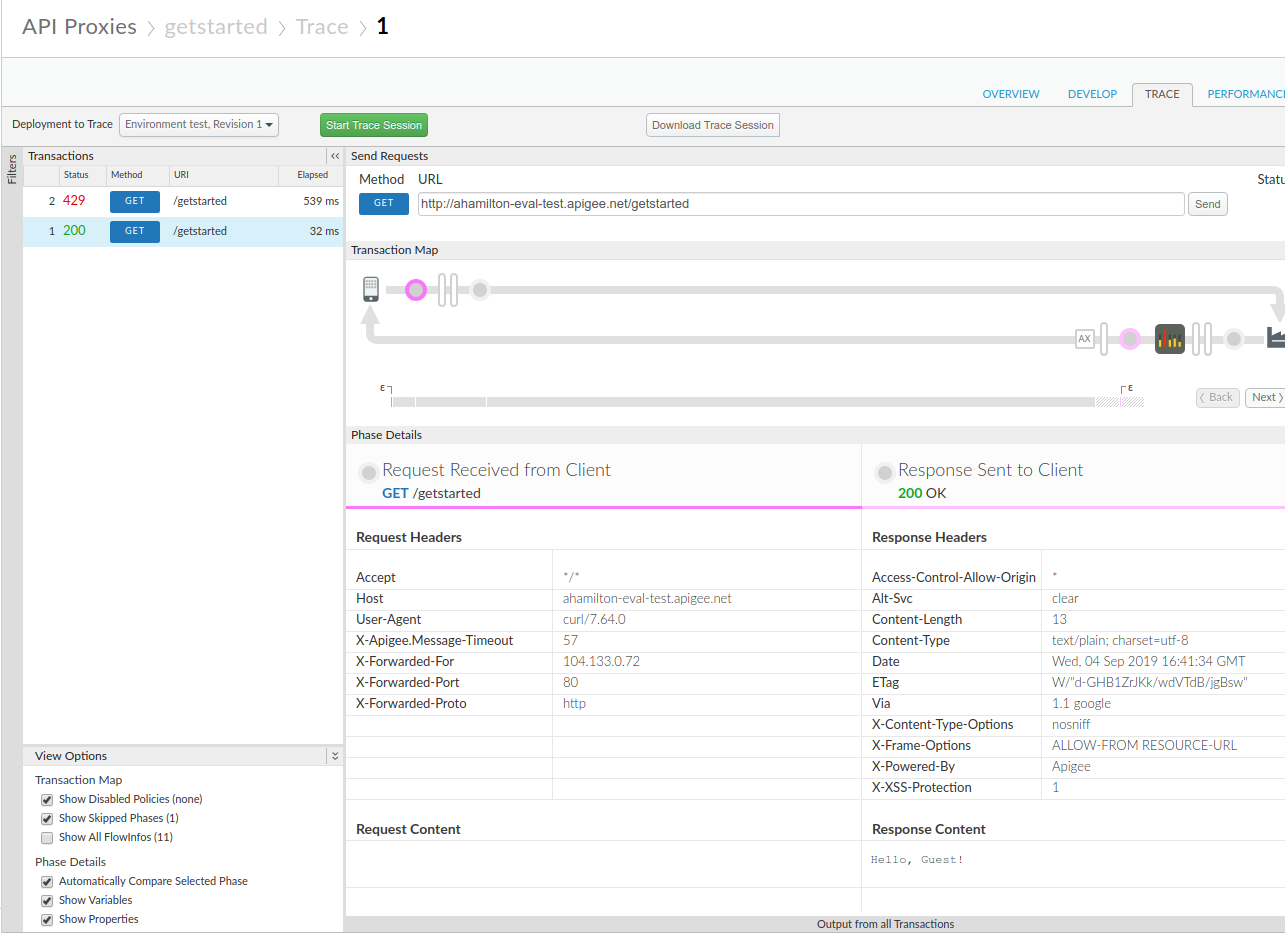
- Click Start Trace Session.

-
Call the API proxy again using
curl(or with the URL in a web browser) until you see at least one 200 response and one 429 response in the Transactions pane of Trace.curl "http://org_name-test.apigee.net/getstarted"
- Click Stop Trace Session.
- Click the 200 transaction in the left Transactions pane. Its Trace detail is loaded in the main window under Transaction Map, which shows a request/response diagram. The Spike Arrest icon is in the request flow.
- In the flow diagram, click the circle icon in the response, the
furthest one to the right (shown in the following diagram).
The Phase Details pane shows the data available at that point in the flow. If you scroll through that pane, you'll see the HTTP response headers and body content.
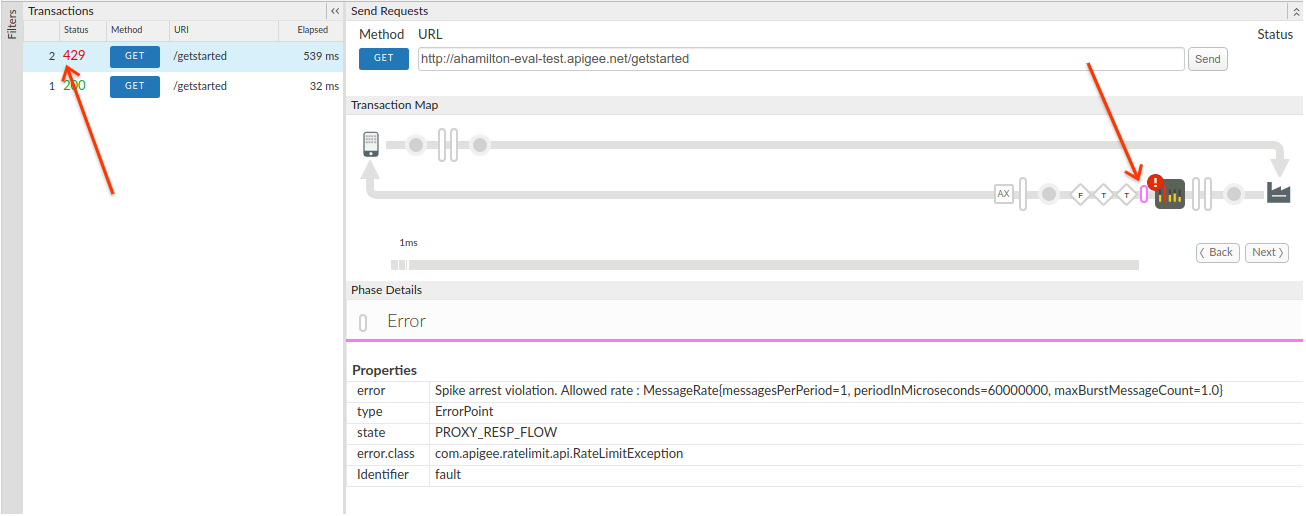
- Now look at an error in Trace.
Click the 429 transaction in the Transactions pane. In the main editor window, you see a flow diagram with items in the request only, including a Spike Arrest icon with a red exclamation point indicating an error.
Click the small tube error icon to the right of the Spike Arrest icon, and look at the spike arrest violation details in the Phase Details pane.
You can click the Back and Next buttons in the flow diagram to move between points in the flow and see the Trace details.
If you want to see the entire Trace as a single document, download it by clicking Download Trace Session.
For more information, see Using the Trace tool.