
Edge for Private Cloud v. 4.16.09
Generally in a production setup, there is a need to enable monitoring mechanisms within an Apigee Edge for Private Cloud deployment. These monitoring techniques warn the network administrators (or operators) of an error or a failure. Every error generated is reported as an alert in Apigee Edge. For more information on alerts, see Monitoring Best Practices.
For ease, Apigee components are classified mainly into two categories:
- Apigee-specific Java Server Services – These include Management Server, Message Processor, Qpid Server, and Postgres Server.
- Third-party Services – These include Nginx Router, Apache Cassandra, Apache ZooKeeper, OpenLDAP, PostgreSQL database, and Qpid.
In an on-premise deployment of Apigee Edge, the following table provides a quick glance into the parameters that you can monitor:
|
Component |
System Checks |
Process-Level Stats |
API-Level Checks |
Message Flow Checks |
Component Specific |
|
|---|---|---|---|---|---|---|
|
Apigee-specific Java Services |
Management Server |
? |
? |
? |
||
|
Message Processor |
? |
? |
? |
? |
||
|
Qpid Server |
? |
? |
? |
|||
|
Postgres Server |
? |
? |
? |
|||
|
Third-party Services |
Apache Cassandra |
? |
? |
|||
|
Apache ZooKeeper |
? |
? |
||||
|
OpenLDAP |
? |
? |
||||
|
PostgreSQL database |
? |
? |
||||
|
Qpid |
? |
? |
||||
|
Nginx Router |
? |
? |
? |
|||
In general, after Apigee Edge has been installed, you can perform the following monitoring tasks to track the performance of an Apigee Edge for Private Cloud installation.
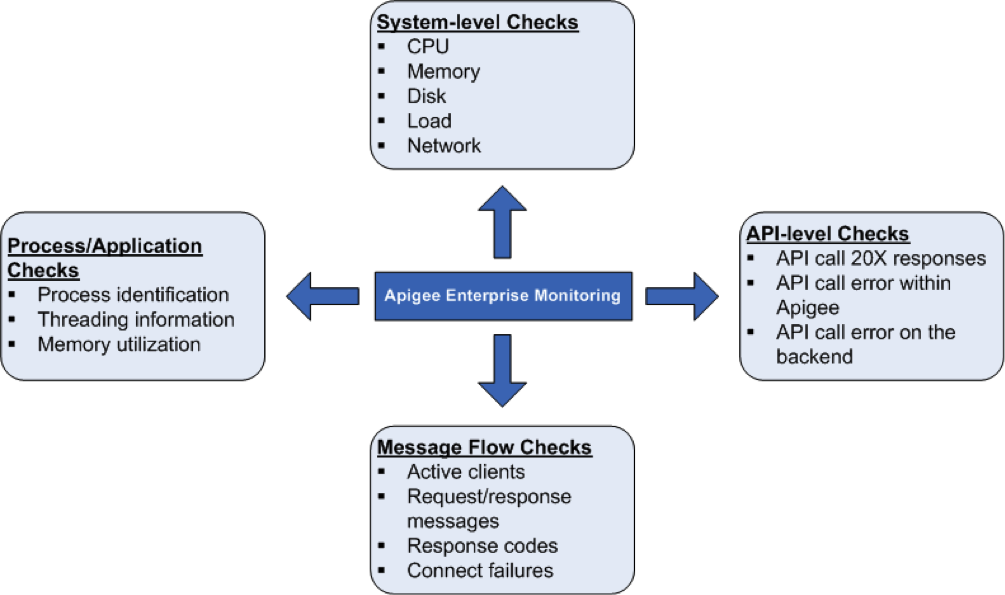
System health checks
It is very important to measure the system health parameters such as CPU utilization, memory utilization and port connectivity at a higher level. You can monitor the following parameters to get the basics of system health.
- CPU Utilization – Specifies the basic statistics (User/System/IO Wait/Idle) about the CPU utilization. For example, total CPU used by the system.
- Free/Used Memory – Specifies the system memory utilization as bytes. For example, physical memory used by the system.
- Disk Space Usage – Specifies the file system information based on the current disk usage. For example, hard disk space used by the system.
- Load Average – Specifies the number of processes waiting to run.
- Network Statistics – Network packets and/or bytes transmitted and received, along with the transmission errors about a specified component.
Processes/Application checks
At the process level, you can view important information about all the processes that are running. For example, these include memory and CPU usage statistics that a process or application utilizes. For processes like qpidd, postgres postmaster, java and so on, you can monitor the following:
- Process identification: Identify a particular Apigee process. For example, you can monitor for the existence of an Apigee server java process.
- Thread statistics: View the underlying threading patterns that a process uses. For example, you can monitor peak thread count, thread count for all the processes.
- Memory utilization: View the memory usage for all the Apigee processes. For example, you can monitor the parameters like heap memory usage, non-heap memory usage used by a process.
API-level checks
At the API level, you can monitor whether server is up and running for frequently used API calls proxied by Apigee. For example, you can perform API check on the Management Server, Router, and Message Processor by invoking the following cURL command:
curl http://<host>:<port>/v1/servers/self/up
Where <host> is the IP address of the Apigee Edge component. The <port> number is specific to each Edge component. For example:
Management Server: 8080
- Router: 8081
- Message Processor: 8082
- etc.
See the individual sections below for information on running this command for each component
This call returns the "true" and "false". For best results, you can also issue API calls directly on the backend (with which Apigee software interacts) in order to quickly determine whether an error exists within the Apigee software environment or on the backend.
Note: To monitor your API proxies, you can also use Apigee's API Health. API Health makes scheduled calls to your API proxies and notifies you when they fail and how. When calls succeed, API Health shows you response times and can even notify you when response latency is high. API Health can make calls from different locations around the world to compare API behavior between regions.
Message flow checks
You can collect data from Routers and Message Processors about message flow pattern/statistics. This allows you to monitor the following:
- Number of active clients
- Number of responses (10X, 20X, 30X, 40X and 50X)
- Connect failures
This helps you to provide dashboards for the API message flow.
Router health check of the Message Processor
The Router implements a health check mechanism to determine which of the Message Processors are working as expected. If a Message Processor is detected as down or slow, the Router can automatically take the Message Processor out of rotation. If that happens, the Router writes a "Mark Down" messages to the Router log file at /<inst root>/apigee4/var/log/apigee/router/logs/system.log.
You can monitor the Router log file for these messages. For example, if the Router takes a Message Processor out of rotation, it writes message to the log in the form:
2014-05-06 15:51:52,159 org: env: RPCClientClientProtocolChildGroup-RPC-0 INFO CLUSTER - ServerState.setState() : State of 2a8a0e0c-3619-416f-b037-8a42e7ad4577 is now DISCONNECTED. handle = <MP_IP> at 1399409512159

2014-04-17 12:54:48,512 org: env: nioEventLoopGroup-2-2 INFO HEARTBEAT - HBTracker.gotResponse() : No HeartBeat detected from /<MP_IP>:<PORT> Mark Down
where /<MP_IP>:<PORT> is the IP address and port number of the Message Processor.
If later the Router performs a health check and determines that Message Processor is functioning properly, the Router automatically puts the Message Processor back into rotation. The Router also writes a "Mark Up" message to the log in the form:
2014-05-06 16:07:29,054 org: env: RPCClientClientProtocolChildGroup-RPC-0 INFO CLUSTER - ServerState.setState() : State of 2a8a0e0c-3619-416f-b037-8a42e7ad4577 is now CONNECTED. handle = <IP> at 1399410449054

2014-04-17 12:55:06,064 org: env: nioEventLoopGroup-4-1 INFO HEARTBEAT - HBTracker.updateHB() : HeartBeat detected from /<IP>:<PORT> Mark Up
To configure the Router to make the health check, set the following property to true in /<inst root>/apigee4/conf/apigee/router/router.properties:
Client.pool.heartBeat.use.http=true
Then, restart the Router:
> /<inst-root>/apigee4/bin/apigee-service router restart