
Edge for Private Cloud v. 4.17.05
The Beta release of the Edge monitoring dashboard helps you understand the health of various components (Routers, Message Processors, ZooKeeper, Cassandra) as well as HTTP error codes for various orgs and environments in your deployment. You can also snapshot these details and share them with Apigee if required for resolving support incidents.
Before using the dashboard
Dashboard display
After installing the dashboard, access it by opening the following URL in a browser:
http://grafana_IP_or_DNS:3000
where grafana_IP_or_DNS is the IP or DNS name of the node running
the Apigee apigee-grafana
component. You will be prompted to enter the administrator's username:password as defined when
you installed apigee-grafana. The
default values from the installation instructions below are admin:admin.
After you log in, you see the following screen:
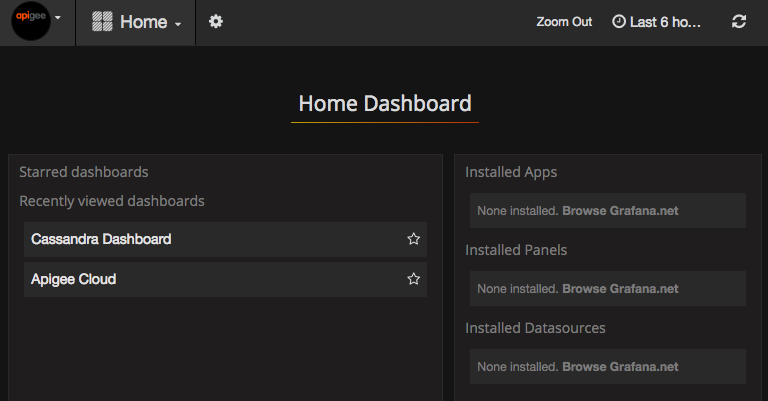
Select the logo in the upper-left corner to open the menu bar. In the menu bar, select Pin to keep the bar open.
In the menu bar, select:
- admin Main Org. to set administrator details, such a password and email address.
- Dashboards > Home to open the screen shown above. Then select Apigee Cloud or Cassandra Dashboard to see the dashboard.
- Data Sources to see the data sources for the apigee-grafana component. Select each data source, and then select the Save & Test button to validate the connection.
- Plugins to display the list of installed plugins.
- Admin to set information about Grafana.
After selecting Dashboards > Home, selecting Apigee Cloud opens the dashboard display shown below:
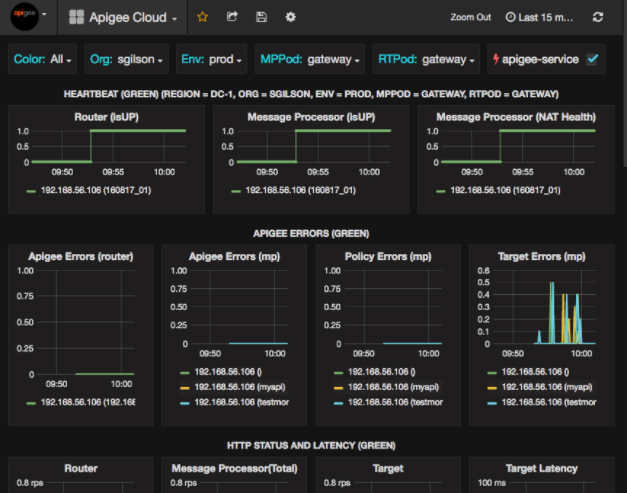
On this screen, you can see information about the:
- Router: status, traffic, errors, load, and more.
- Message Processor: status and health, traffic, target latency, target response codes, and more.
- Node metrics: CPU usage, disk space, heap usage, and more.
Notice the buttons across the top of the charts:
- Color: set to All. All is the only supported option.
- Org: set to the name of your organization.
- Env: Set to the name of an environment in the organization.
- MPPod and RTPod: set to the pod name of the Message Processors and Routers. By default it is "gateway" unless you changed it at install time.
- apigee-service: check to display information about executions of the
apigee-serviceutility.
Some of the charts show information for individual API proxies and all API proxies together.
For example, in the chart below, you can see a line for all proxies, identified by the green line
for 192.168.56.103(), the IP
address of the Message Processor:
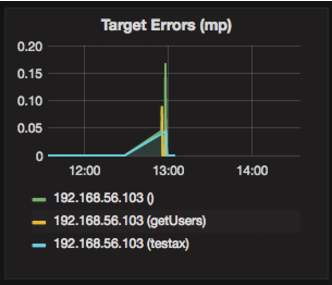
There are also individual lines in the chart for different API proxies named
getUsers and testAX, identified in the chart as the orange
line for 192.168.56.103(getUsers)
and the blue line for 192.168.56.103(testax).
By default, the dashboard shows information for the last 5 minutes. Select the Today at the top-right of the dashboard to select a different interval.
Sending a dashboard snapshot to Apigee
To help Apigee diagnose and debug an issue, you can send a snapshot of your dashboard to Apigee Support. Apigee can then inspect your dashboard to help determine the cause of the issue.
To send a dashboard snapshot to Apigee:
- Select the Share Dashboard icon at the top of the dashboard (highlighted
in the red box below):
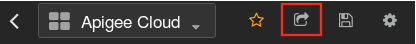
- In the pop-up window, select Snapshot Sharing.
- Leave all fields as they are, and select the Publish to snapshot.apigee.net button.
- A pop-up window appears containing a link. Copy that link and send it to Apigee.
Dashboard components
The dashboard relies on several components that you install after installing Edge:
apigee-telegrafA wrapper component for telegraf, that gathers metrics from the system and running components and pushes them to the
apigee-influxdbTime Series DataBase (TSDB).Install this component on all Edge runtime and data components such as the Edge Message Processor, Router, Postgres server, Cassandra, and Zookeeper nodes.
apigee-influxdbA wrapper component for influxdb, that stores the metrics data and exposes it through an API so the data can be rendered in a UI by using
apigee-grafana.Install this component centrally so it can be accessed by all the
apigee-telegrafcomponents running on individual Edge nodes.apigee-grafanaA wrapper component on top of grafana, that provides a powerful and elegant way to create, explore, and share dashboards and data with your team and Apigee for troubleshooting.
Install this component on the node where you want to view the dashboard.