You're viewing Apigee Edge documentation.
Go to the
Apigee X documentation. info
Use this topic to get an introduction to the Apigee Sense console. In the console, you can view the results of the Apigee Sense analysis of traffic to your API proxies. When you identify clients making suspicious requests, such as in a bot attack, you can use the console to take action by blocking or flagging requests from that client's IP address.
As described in What is Apigee Sense?, Apigee Sense collects and analyzes data about requests to your APIs. Through this analysis, Apigee Sense identifies patterns that might represent suspicious requests. With the Apigee Sense console, you can view and act on request analysis results.
- Open the New Edge experience.
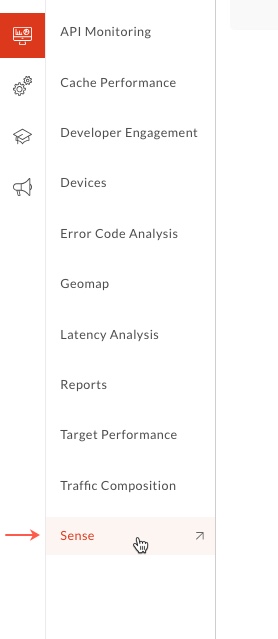
In the New Edge experience, click the Analyze menu, then click Sense.
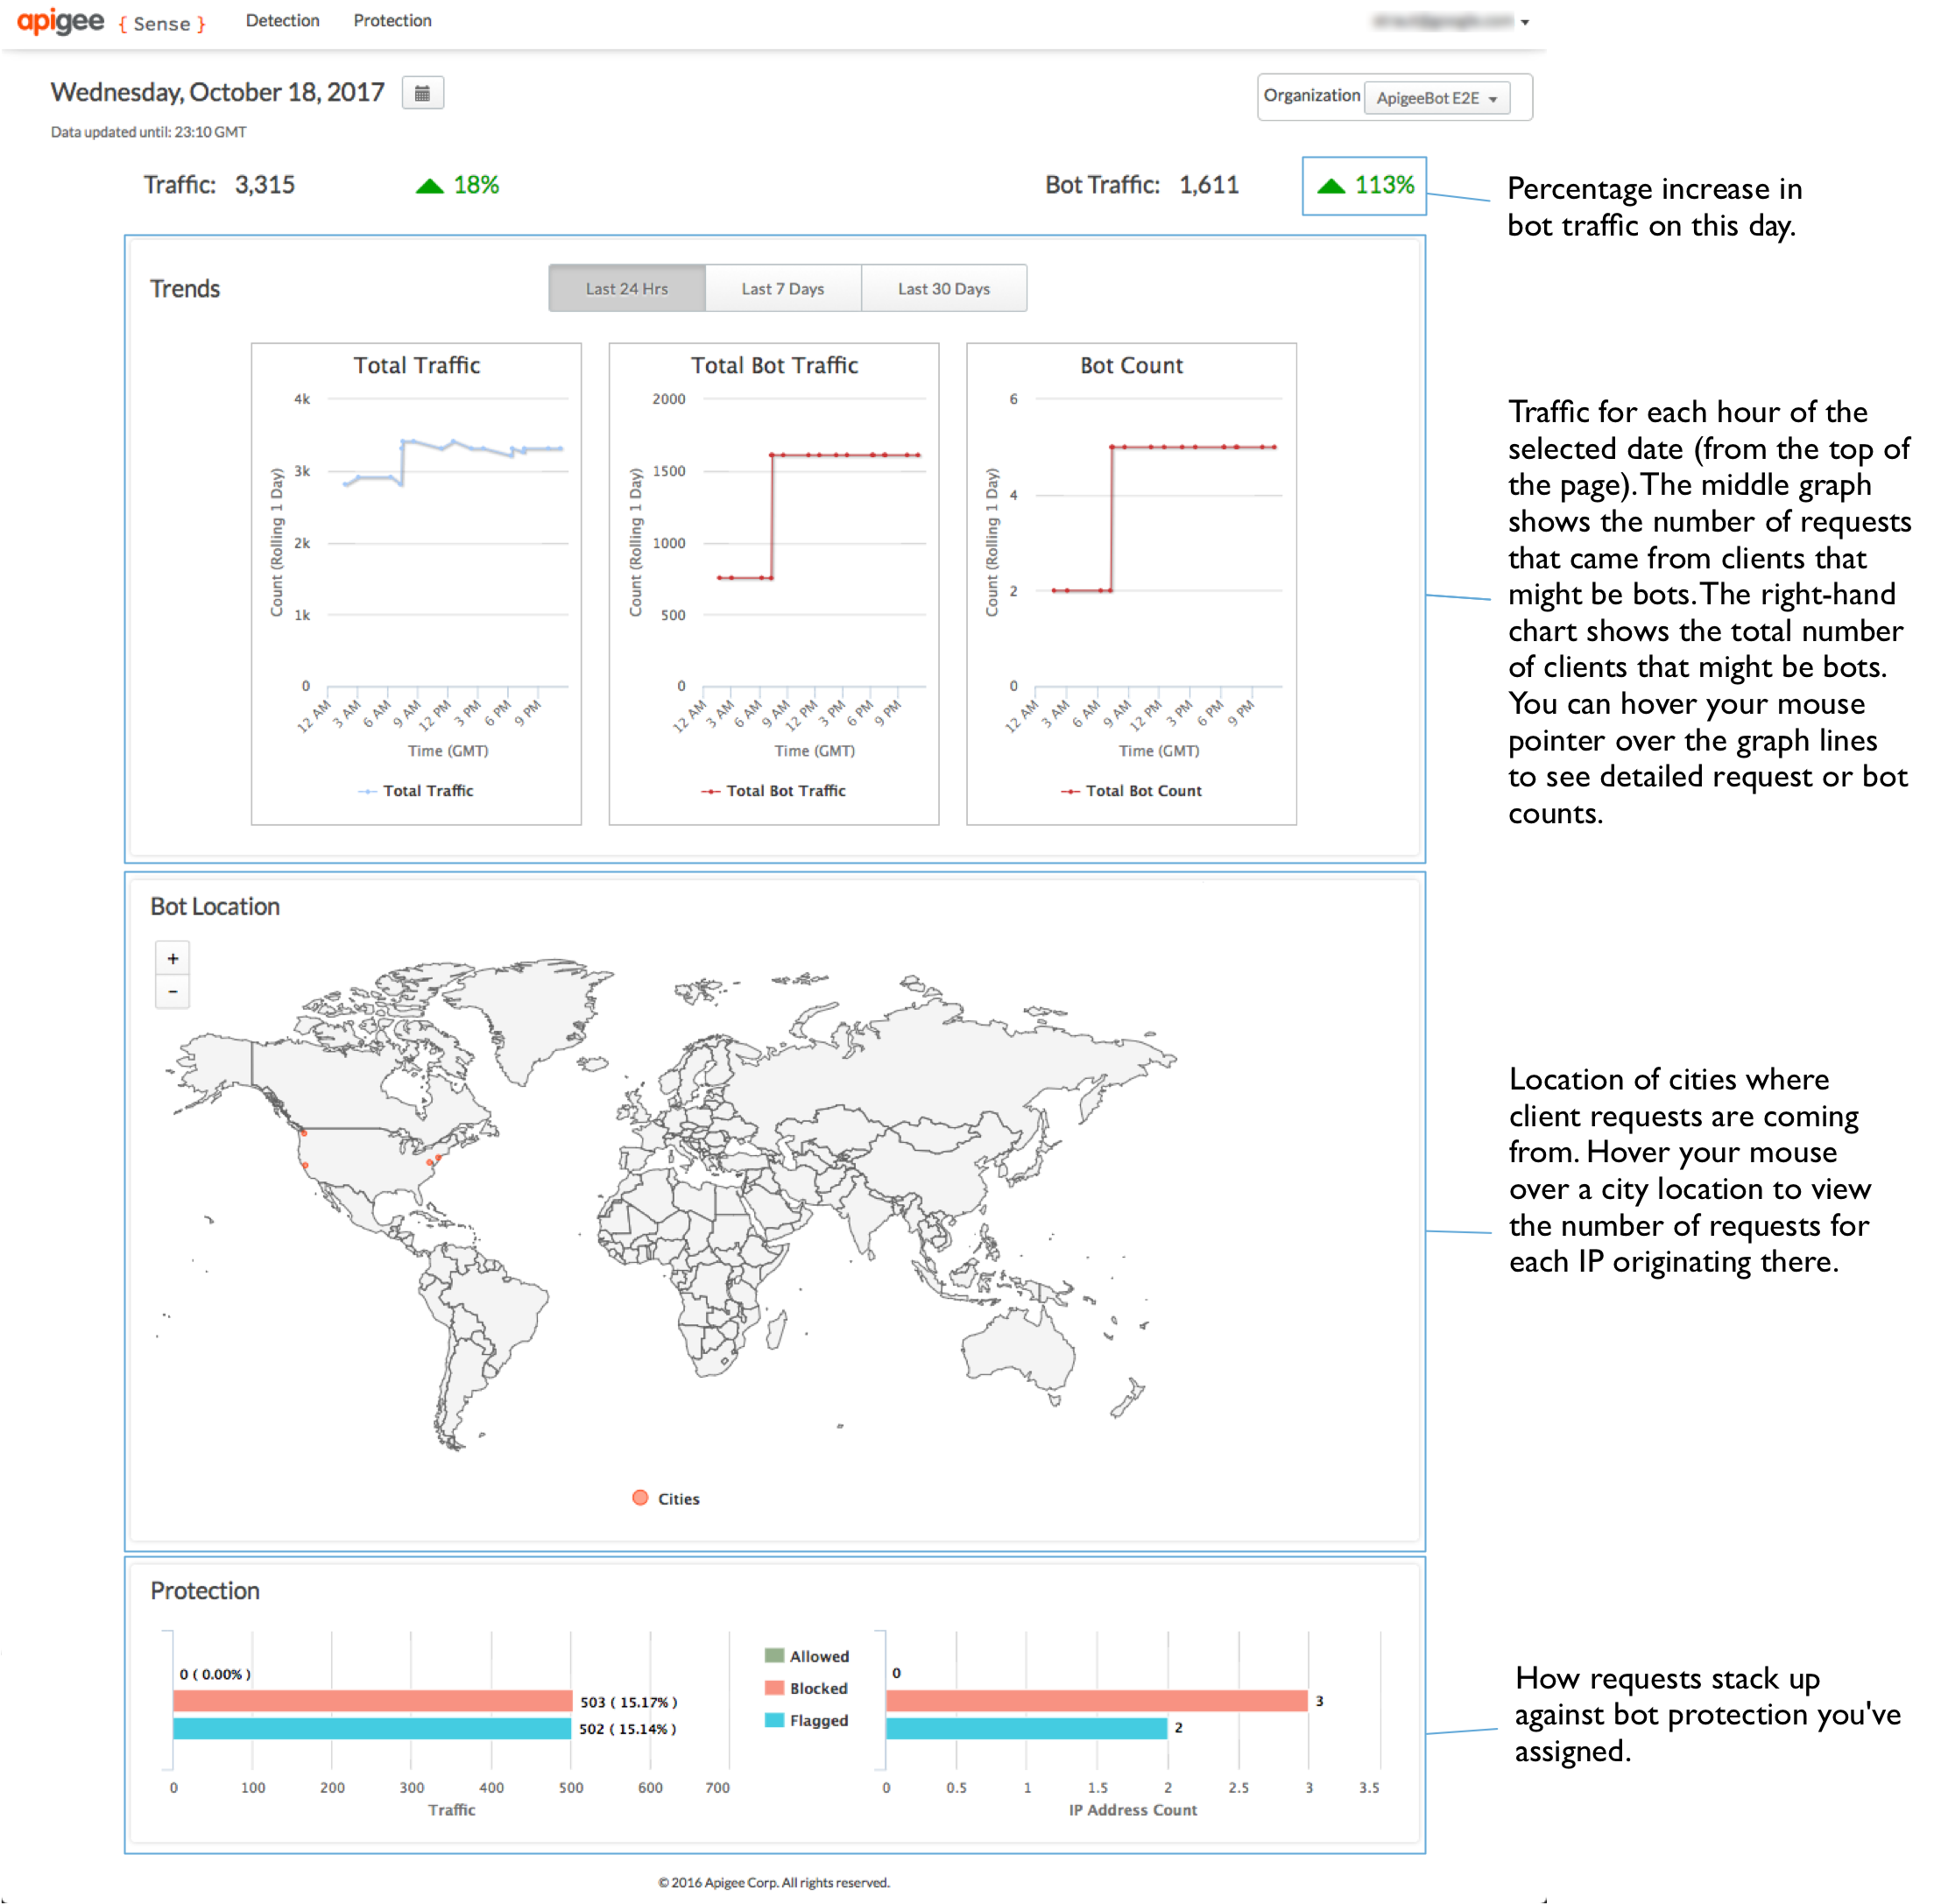
On the Sense page, you'll see a graphical snapshot of request activity, including suspicious requests.
In the upper-right corner of the console, select the Apigee Edge organization for which you want to view request data.
This is the organization containing API proxies for which Apigee Sense is collecting request data.
In the upper-left corner, select a date for which you have Apigee Sense analysis data.
With a date selected, the graphs on this page provide a very high-level overview of Apigee Sense analysis, including request traffic.
View the request analysis summary
You can get a high-level view of suspicious activity. Using this, you can drill down for more detail.
At the top of the page, click the Detection > Report menu to view data about suspicious activity found among requests.
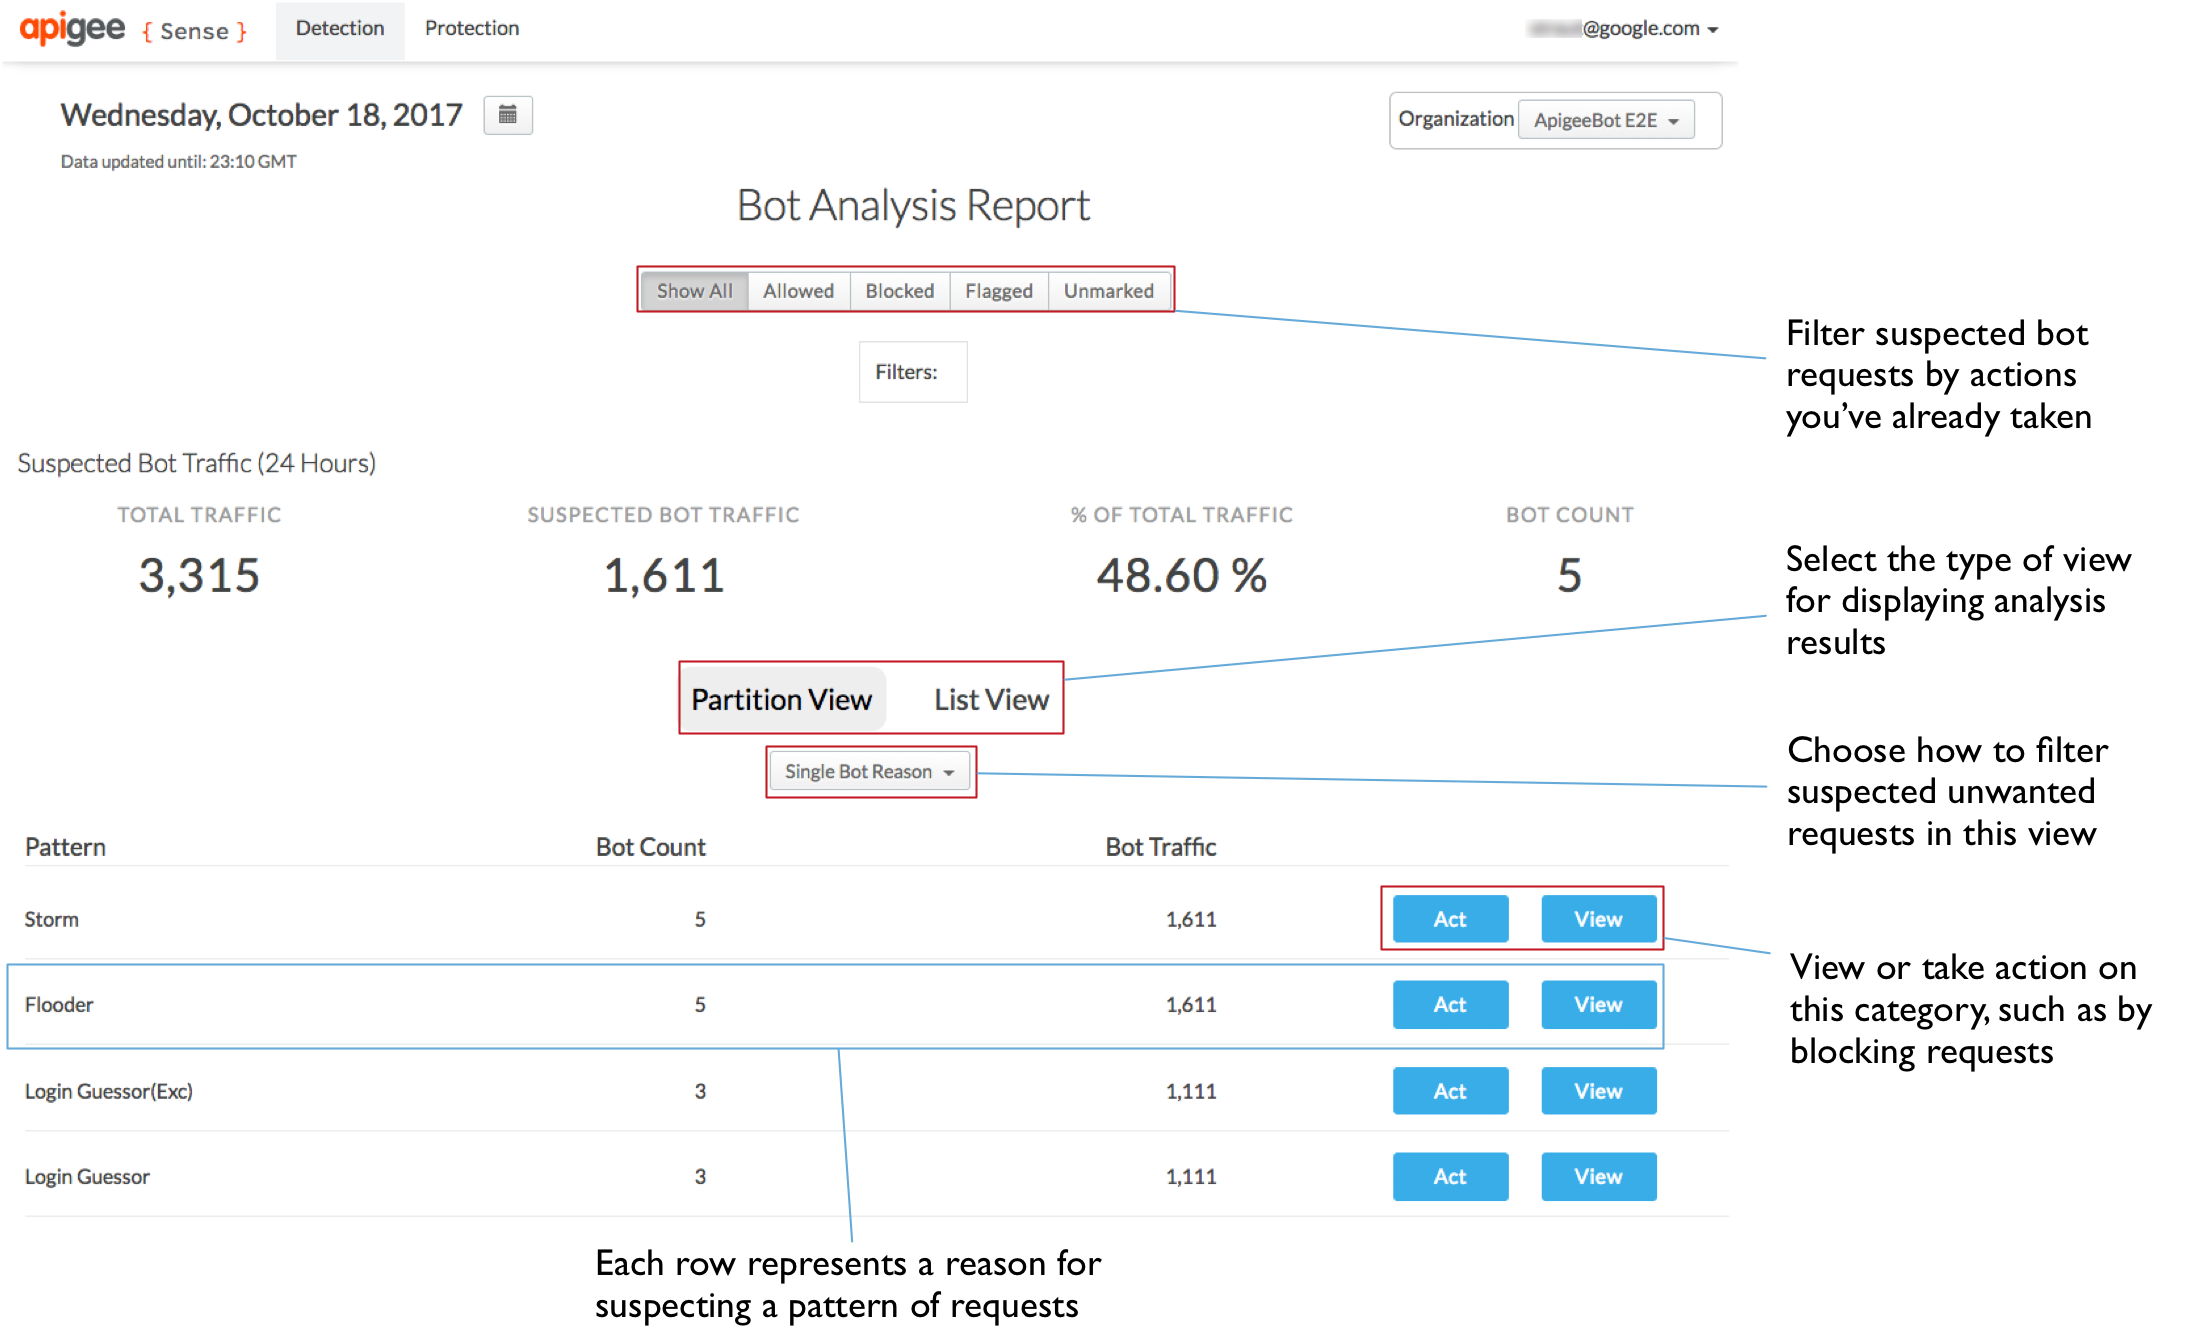
On the Bot Analysis Report page, the Suspected Bot Traffic section at the top summarizes the traffic, with measurements specific to suspicious requests.
The Detection page also provides two views of suspicious activity.
- Partition View groups clients by the reason Apigee Sense is presenting them as suspicious.
- List View lists the request clients by their IP address, along with several other aspects of the data.
In the Partition View, you can view traffic categorized into patterns that represent suspicious activity. For more about patterns, see Taking action on suspicious activity. Request traffic grouped into these patterns is a product of Apigee Sense analysis of your request data.
Not all requests conforming to a pattern are abusive. You're looking for very high bot count and/or traffic numbers.
For example, the Login Attempter pattern represents a large number of attempts to reach a login proxy in a 24-hour window. In the following image, a very high Bot Count number (relative to other patterns) indicates that a large number of clients are attempting -- in a single day -- to reach the login proxy. That makes this pattern worth investigating.
Investigate using analysis details
Once you've identified a set of requests that might comprise suspicious activity, such as a bot attack, you can get a more detailed view of the requests. Isolating genuine bot attacks will require combining Apigee Sense analysis with your own knowledge of clients calling your APIs.
In the Partition View on the Detection page, locate a pattern you're interested in -- such as one with a very high bot count -- and click its View button to see details about what the pattern represents.
Here, you have a drill-down view of activity conforming to the pattern you selected. There are a few noteworthy pieces of data from the list shown here:
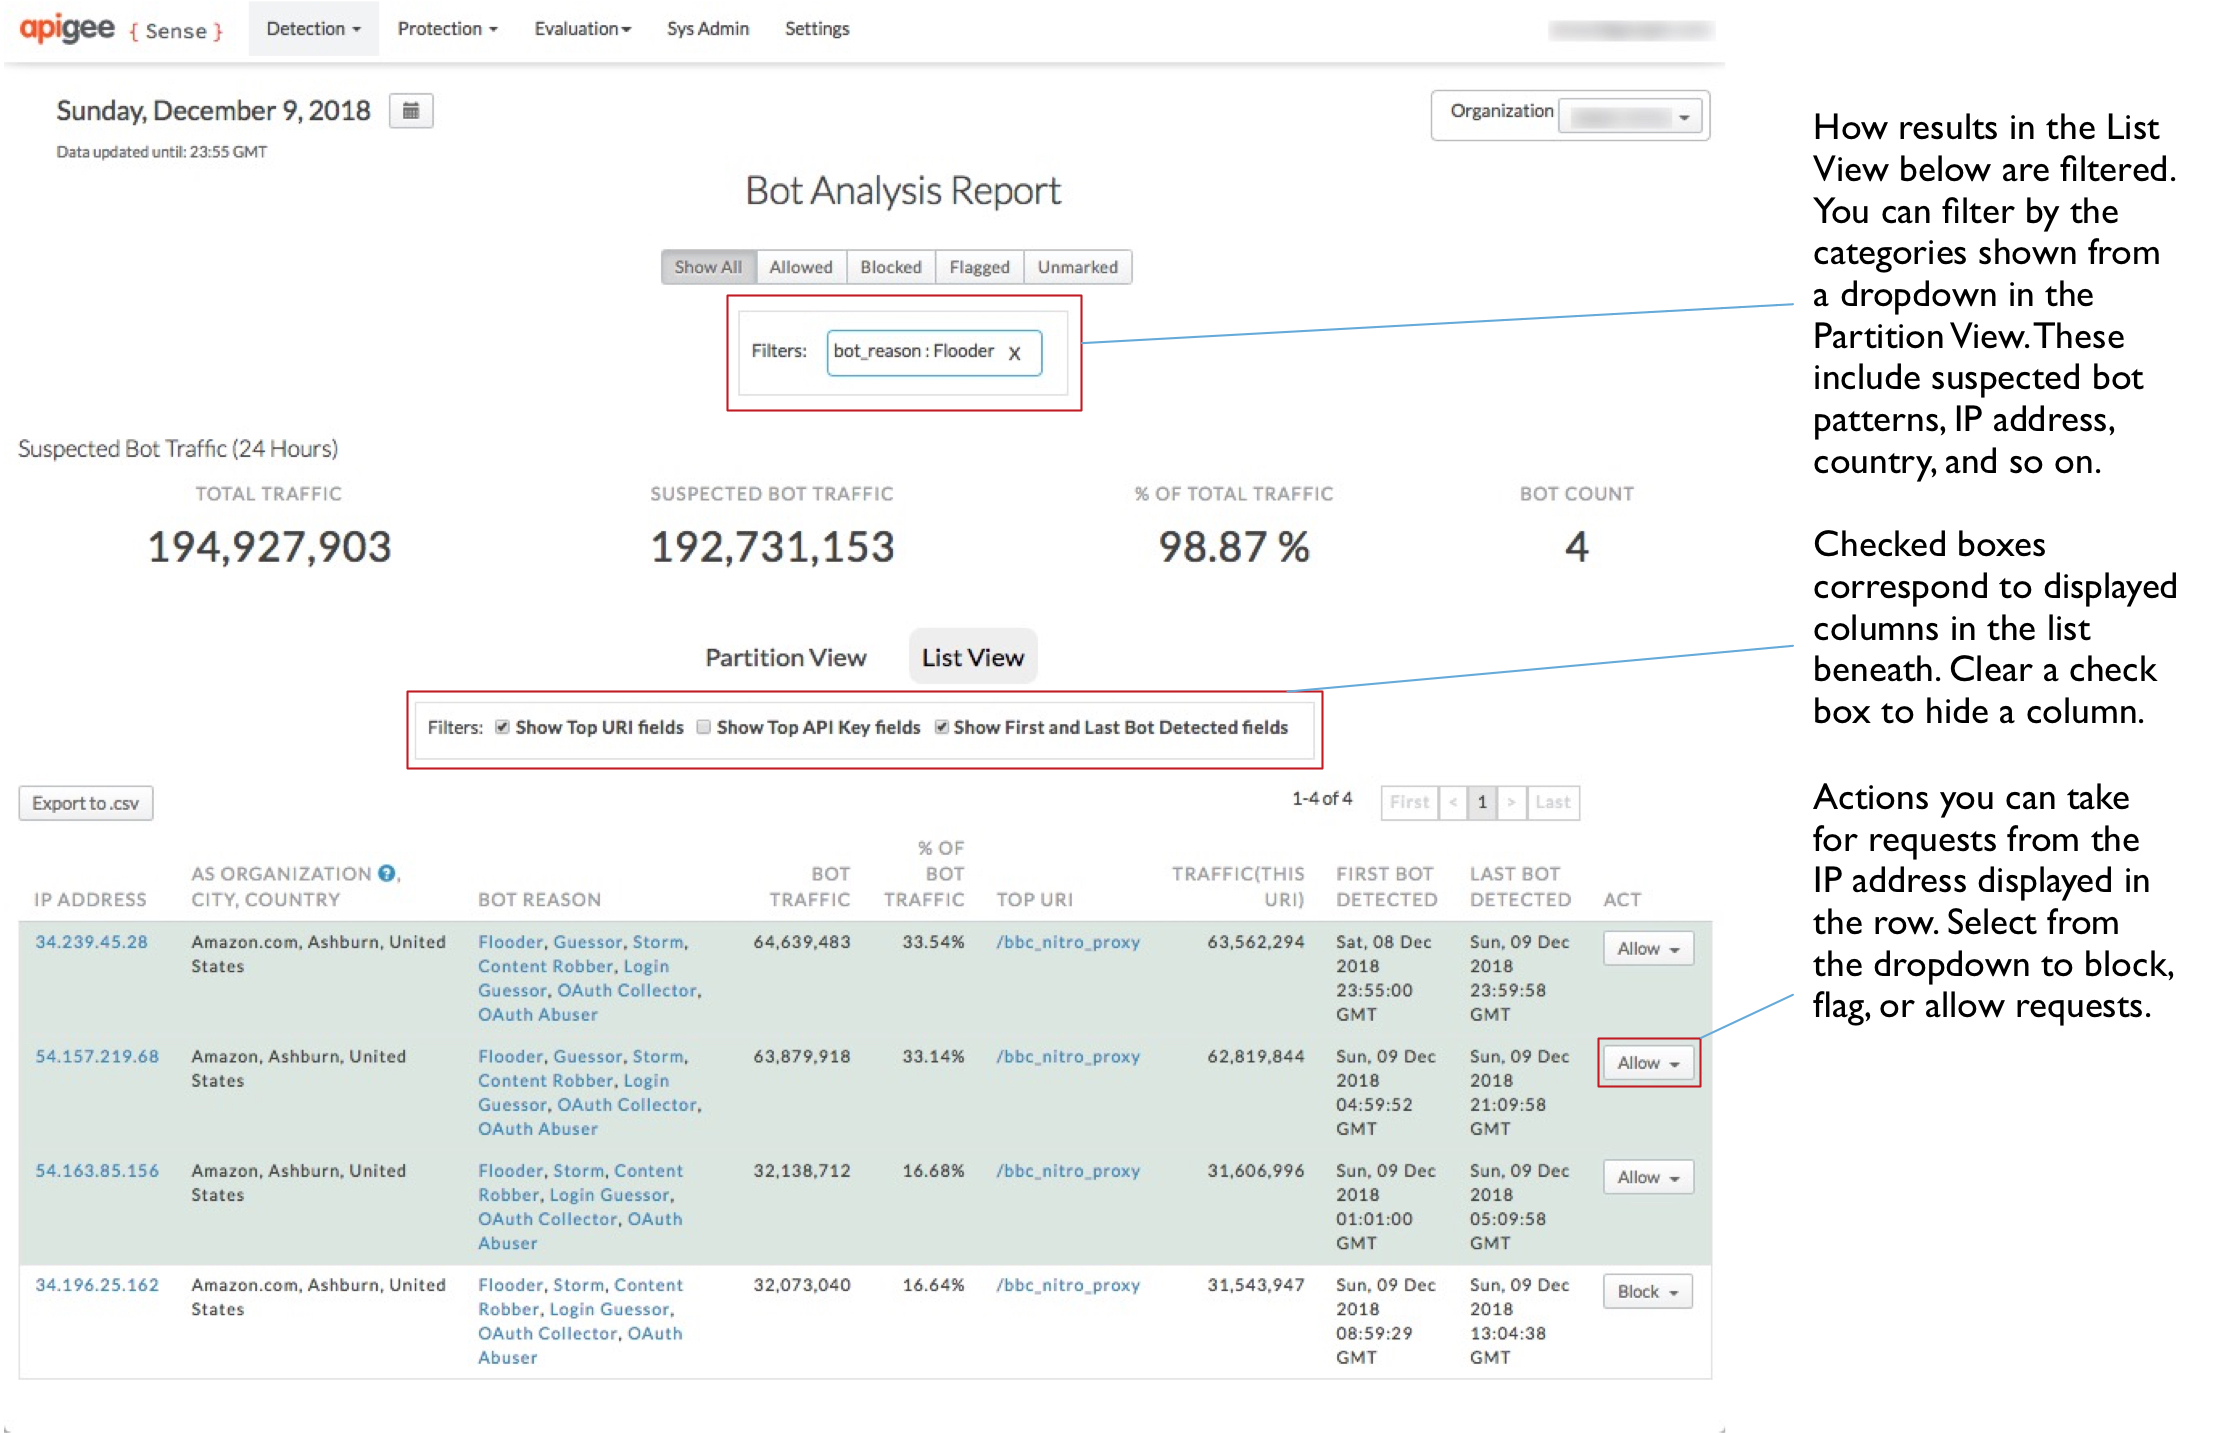
- There's a large number of IP addresses -- almost a thousand in 24 hours.
- There's a comparatively small number of autonomous system (AS) organizations behind those IPs, and the AS organizations are widely distributed, geographically.
- The bot traffic count is pretty consistent at around 250 - 260 each across IPs. This is represented also by the % of bot traffic measurement.
Taken together, this information suggests that requests from these IPs represent a coordinated, mechanized attack on the login URI.
To view even more detail about a single client, click one of the IP addresses in the left column.
Click the Detection tab to see what Apigee Sense has discovered about requests from the IP address.
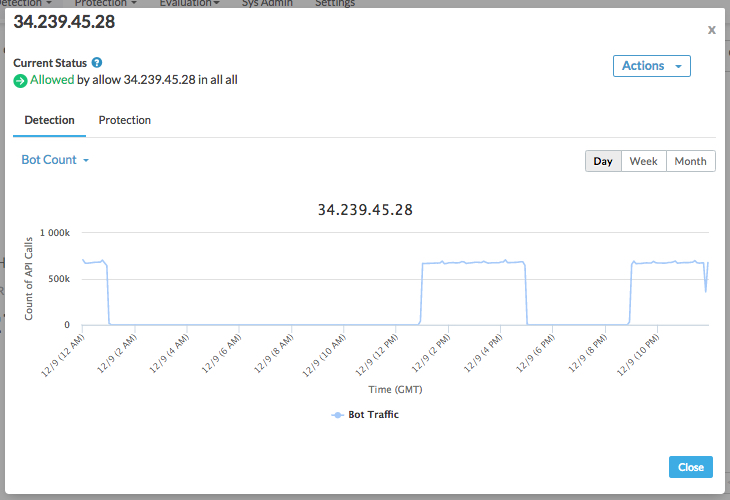
At the top of the dialog, you'll see a list of the behaviors detected by Apigee Sense for requests from this IP address.
Under Detection, use the categories in the dropdown to decide whether the requests coming from an IP address should be handled differently by Apigee Edge. For example, the following value categories can help you figure out whether the IP address represents an attack:
- Response status code. A list dominated by a high number of error codes such as 500 suggests a client trying repeatedly with the wrong request. In other words, a client that's simply sending the request repeatedly without being aware of an error result.
- Request URI. Some URI are especially significant as attack points. A login URI is one of them.
Click the Protection tab to see a list of protection rules that have already been enabled for requests from this IP address.
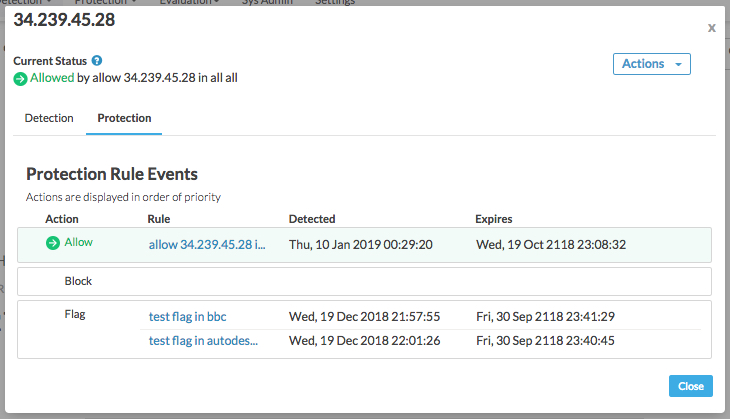
The rules are listed in precedence order, with the highest precedence action (Allow) at the top and lowest (Flag) at the bottom. In Apigee Sense, you can take multiple kinds of actions on a single IP address. Usually, that's because you're taking action on a behavior that includes multiple IP addresses -- such as to block brute guessors. However, some IP addresses might fit unwanted behavior patterns, such as Brute Guessor, but still be friendly IPs, such as when you or a partner are testing your system. In such a case, you'd allow those specific IP addresses, regardless of their behavior. So although actions of all three types would be enabled for the IP address, the Allow action would take precedence over a Block or Flag action.
After you've confirmed that an IP likely represents a client you want to take action on, you can act to intercept requests from that client.
In the Detailed View, click the Close button.
Take action on clients making suspicious requests
Confident you've got a client whose requests you want to intercept -- such as a bot attack? Compose a rule to block or flag requests from the client before the request reaches your proxies.
On the Detection page, in the Bot Analysis Report, click the Partition View tab to go back to viewing the pattern list.
In the Partition View, note that the pattern list has been shortened to include only the pattern you selected to view earlier. That's because when you selected to view the pattern, you began filtering the full list of results to only that pattern. The patterns you're filtering for are shown in the Filters box near the top of the page.
In the row for the pattern, click the Act button to specify an action to take for requests from IPs that match the pattern.
In the Compose Rule dialog, define how Apigee Edge will respond to requests from IPs making calls in the pattern you selected.
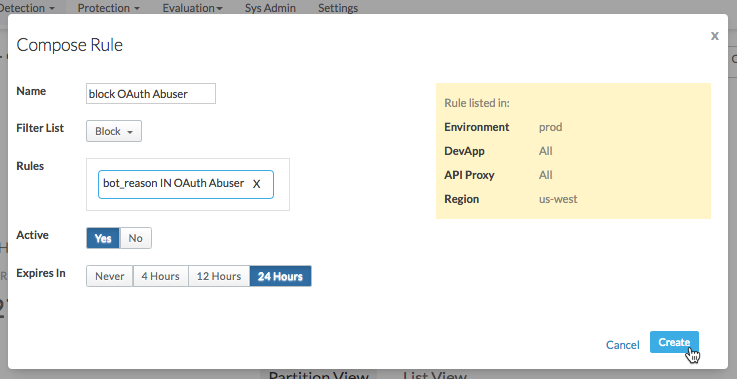
Here, you'll specify a rule that Apigee Edge uses when requests are received from an IP in the pattern.
- Enter a name for the new rule, such as
Block login attempters. In the Filter List, select the action you want Apigee Edge to take:
- Allow the request to proceed into your proxy as before.
- Block the request completely before you proxy begins to process it.
- Flag the request by having Apigee Edge add a special HTTP header that your proxy can look for. Apigee Edge will add an
X-SENSE-BOT-DETECTEDheader with a value ofSENSE. For example, you might want to set up your proxy so that when you receive a request from a particular client, you can send back dummy data to mislead them. In your proxy, you'd examine the headers of incoming requests, then respond appropriately when a flagged request is received.
In the Rules box, confirm that the rules displayed are those you want Apigee Sense to use when creating the rule.
For Active, select Yes to turn the rule on.
Select a period after which you want the rule to expire (for Apigee Edge to stop enforcing it).
- Enter a name for the new rule, such as
Click Create to send the rule to Apigee Edge.
Review rules you've created
If you've acted to put rules in place to respond to certain clients, you can manage the rules on the Protection Rules page.
- At the top of the page, click the Protection > Rules menu to see a list of the rules you have in place.
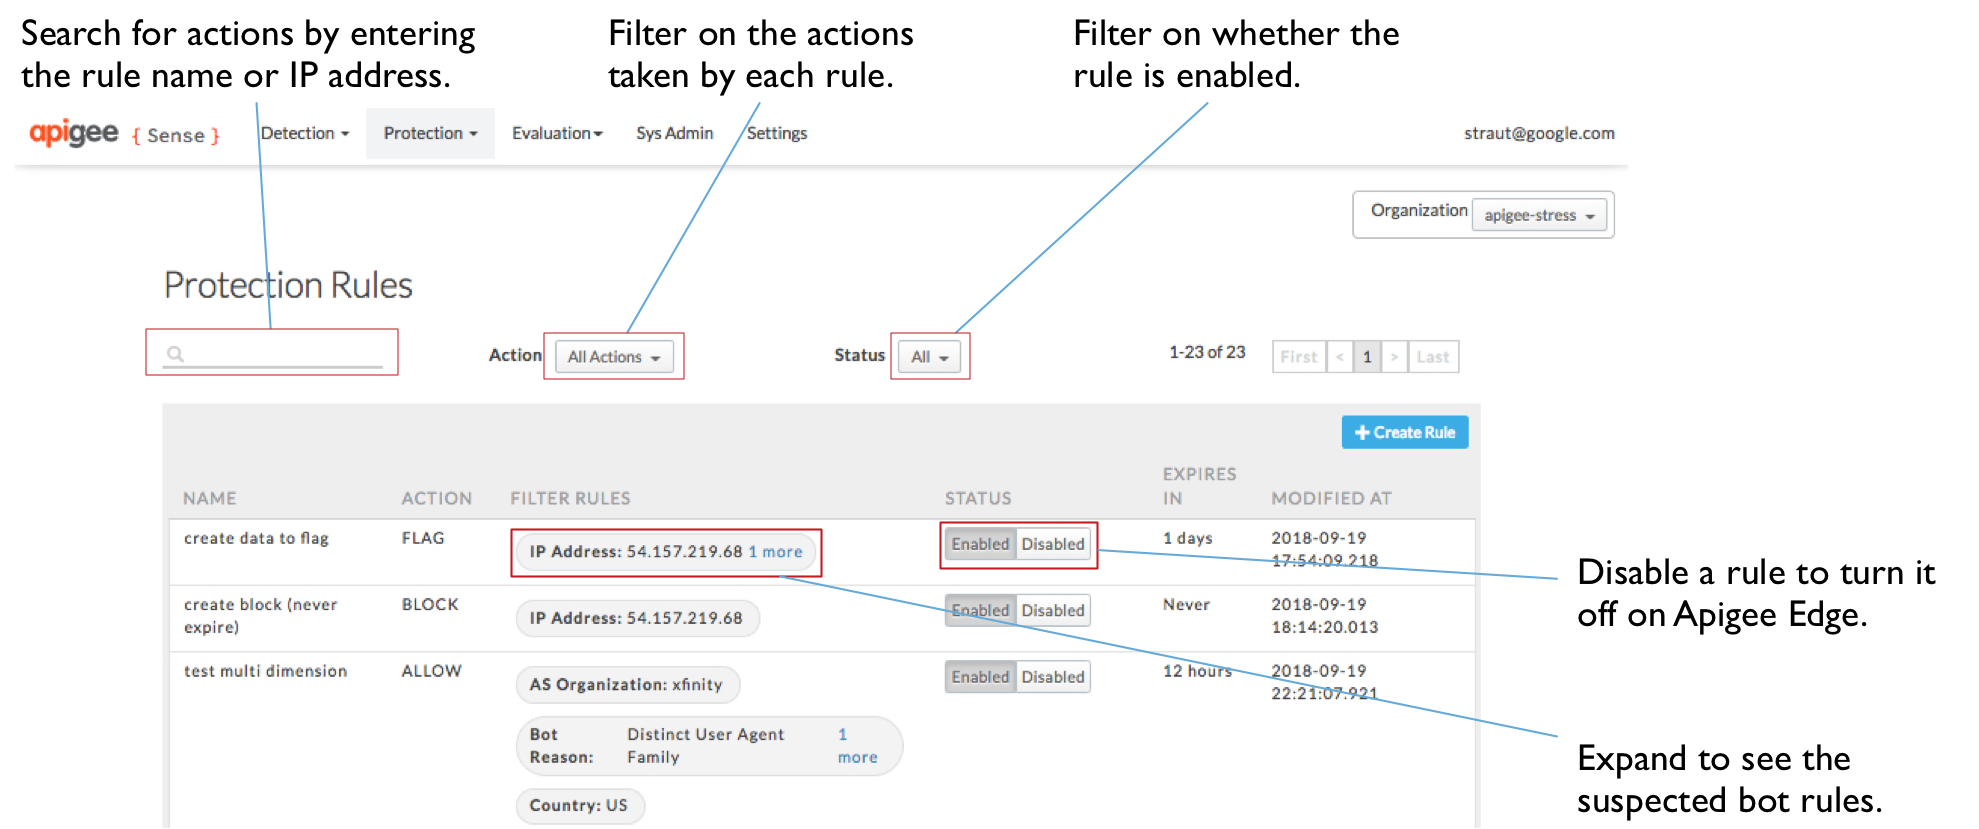
- On the Protection Rules page, you can view the list of rules you've created. From here you can:
- Enter a value in the search box to filter rules by values in the list, such as name or IP address.
- View the details of a rule, or find out which IPs you're taking action on.
- Click a value in the Filter Rules column to see what makes up the rule there.
- Enable or disable rules.
