When Edge detects an alert condition, it automatically logs that condition to the
Events dashboard in the Edge UI.
The list of events displayed in the Events dashboard includes all alerts.
To view an alert in the Events dashboard:
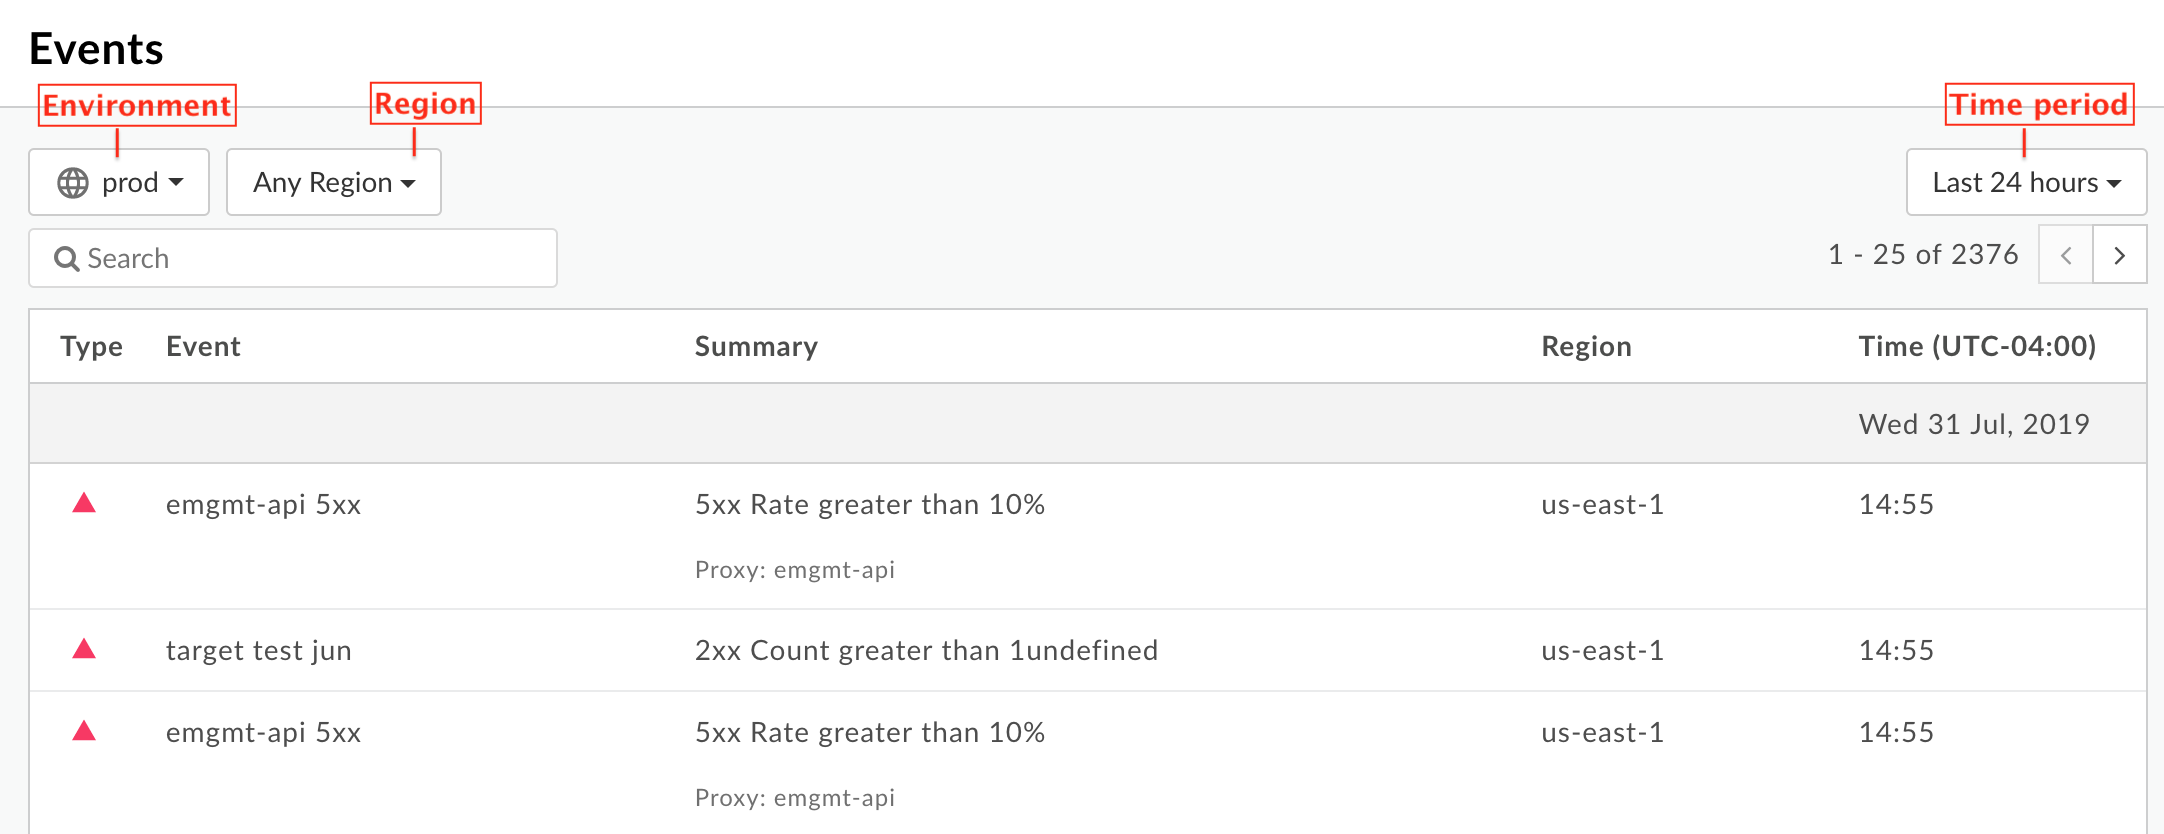
Click Analyze > Events in the Edge UI. The Events dashboard appears:
Filter the Events dashboard by:
Environment
Region
Time period
To drill down into an alert:
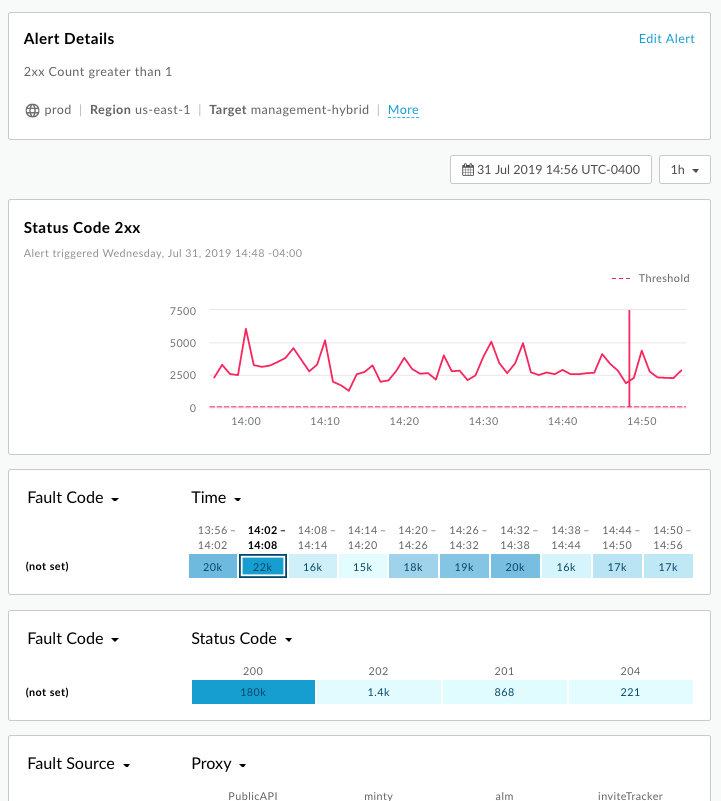
Select the row for the alert in the Events dashboard to open the alert
in the API Monitoring Investigate dashboard.
In the example below, you investigate an alert for HTTP 2XX counts:
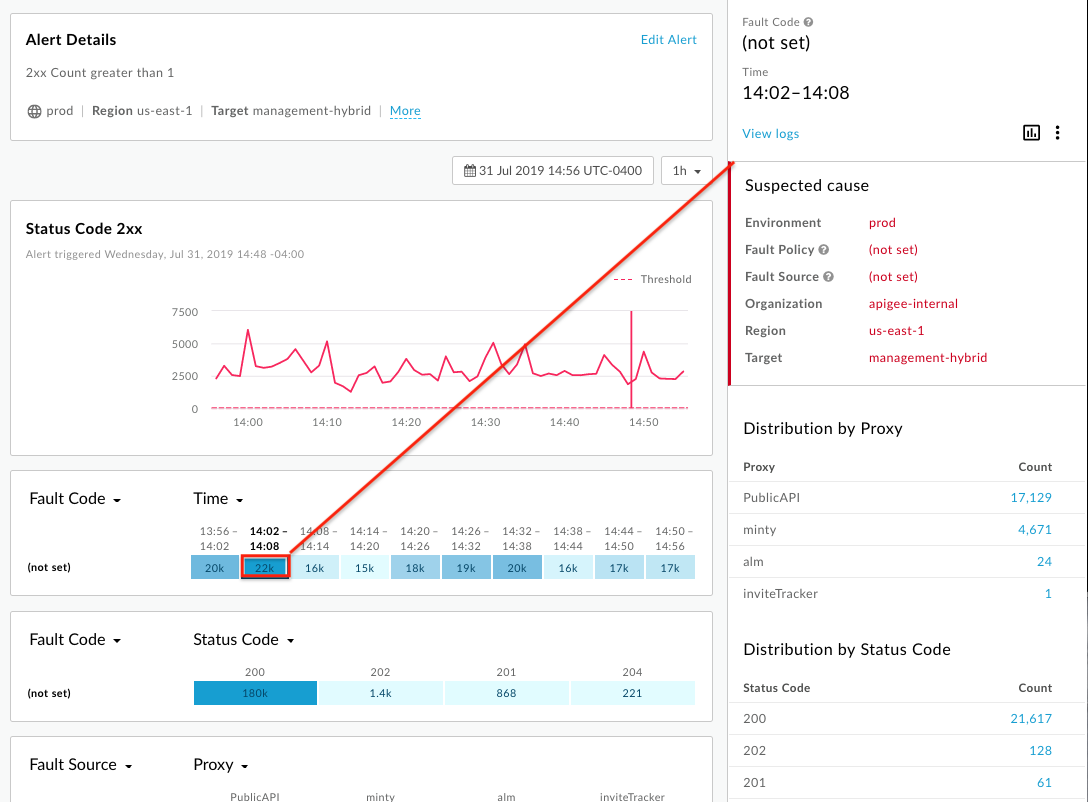
Click a block in the display to view the alert details:
[[["Easy to understand","easyToUnderstand","thumb-up"],["Solved my problem","solvedMyProblem","thumb-up"],["Other","otherUp","thumb-up"]],[["Missing the information I need","missingTheInformationINeed","thumb-down"],["Too complicated / too many steps","tooComplicatedTooManySteps","thumb-down"],["Out of date","outOfDate","thumb-down"],["Samples / code issue","samplesCodeIssue","thumb-down"],["Other","otherDown","thumb-down"]],["Last updated 2026-02-02 UTC."],[],[]]