You're viewing Apigee Edge documentation.
Go to the
Apigee X documentation. info
The following provide frequently asked questions:
- I have many API proxies. What are some recommended approaches for setting up alerts for all of my API proxies?
- Which roles can access API Monitoring?
- Why am I not seeing all API proxies listed in the Recent page?
- Why don't I see latency graphs in the Timeline?
- Logs are useful for identifying the status codes that are resulting in errors, but how do I identify the developer IDs that generate the calls?
- Can I monitor a proxy chain?
- Why do I see "not set" in the dashboards?
- Is API Monitoring available in the Classic UI or Edge for the Private Cloud?
- What is a playbook?
- How can I handle HTTP 429 fault codes?
I have many API proxies. What are some recommended approaches for setting up alerts for all of my API proxies?
Apigee recommends the following approaches:
- Start by setting up alerts for any API proxy with a specific threshold. For example, 10% 4xx error rate for 5 minutes. Set up notifications and view the Alert History page to monitor the alerts that are triggered. Set up additional alerts and notifications for specific API proxies and target services. Continue to refine alerts and notifications based on your observations.
- Ask teams that are responsible for developing APIs to recommend error rate and latency thresholds to the Operations team responsible for setting up alerts.
Which roles can access API Monitoring?
See About the API Monitoring roles.Why am I not seeing all API proxies listed in the Recent page?
The Recent dashboard displays only the API proxies that have had traffic in the recent past. It does not display all API proxies in your organization. The Timeline dashboard enables you to view data for all API proxies.Why don't I see latency graphs in the Timeline?
The Latency graphs are displayed in the Timeline only if you select a region and an API proxy, and the time range selected is no greater than 7 days.Logs are useful for identifying the status codes that are resulting in errors, but how do I identify the developer IDs that generate the calls?
Developer IDs are not included in the API Monitoring logs. To retrieve developer IDs, you can run a custom report.Can I monitor a proxy chain?
You can use one API proxy as the target endpoint of another API proxy, effectively connecting the two proxies in a proxy chain. However, API Monitoring only logs requests to the first proxy in the chain, not to the API proxy used as the target. See Chaining API proxies together for more.Why do I see "not set" in the dashboards?
If the API proxy, fault source, fault code, or fault policy does not have a value or cannot be determined, the dashboard will display "not set" as the origin. Examples of scenarios that may result in "not set" include:
- Client-related errors
- HTTP error codes that are overridden with success response
- HTTP 2xx status codes (since they don't typically result in fault codes)
For more information about "not set", see What does an analytics entity value "(not set)" mean?
Is API Monitoring available in the Classic UI or Edge for the Private Cloud?
Apigee API Monitoring is currently available only to Apigee Edge Cloud Enterprise customers using the new Edge UI.
Apigee API Monitoring is not available in the Classic Edge UI or in Edge for Private Cloud.
What is a playbook?
When setting up an alert, in the Playbook field you provide a short description of recommend actions for resolving the alerts when they fire. You can also specify a link to your internal wiki or community page where you reference best practices. The information in this field will be included in the notification.How can I handle HTTP 429 fault codes?
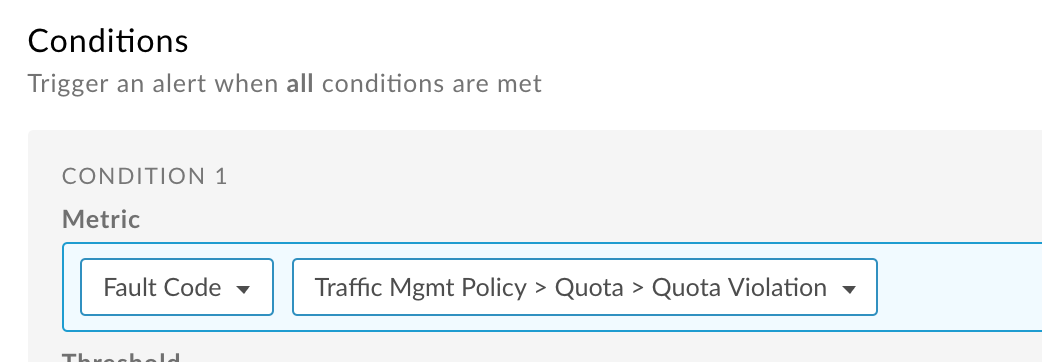
The Edge Quota policy and SpikeArrest policy both issue an HTTP 429 fault code when a quota is exceeded (Quota policy) or the rate limit is exceeded (SpikeArrest policy).However, in the Alerts dashboard, you cannot define an alert for an HTTP 429 fault code. Instead, you set an alert condition of Traffic Mgmt Policy > Quota > Quota Violation, as shown below, or Traffic Mgmt Policy > Spike Arrest > SpikeArrest Violation: