
You're viewing Apigee Edge documentation.
Go to the
Apigee X documentation. info
The Recent dashboard enables you to monitor recent API traffic for all API proxies and targeted services in your organization over the last hour. API monitoring data can be displayed as a detailed list or heat map. Explore each view in the following sections:
Use the List view
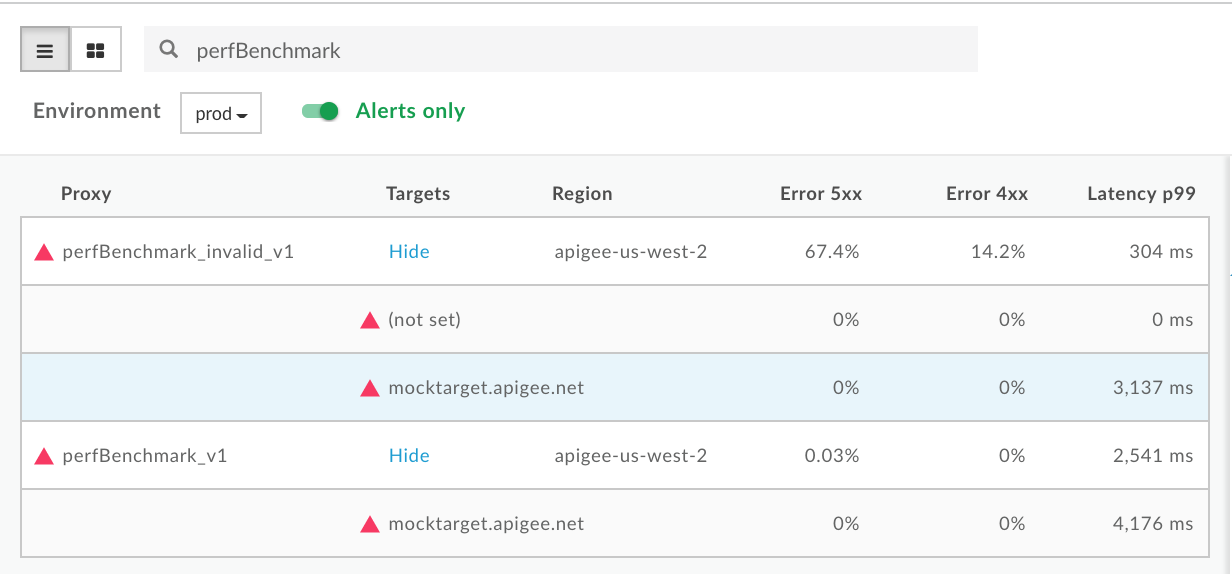
The List view displays summary information for the API proxies and target services in your organization that have had traffic in the recent past.
Explore the list view
To display the List view, select Analyze > API Monitoring > Recent in the Edge UI.
The List view is displayed by default. Navigate back to the List view at anytime by clicking ![]() in the Recent dashboard.
in the Recent dashboard.
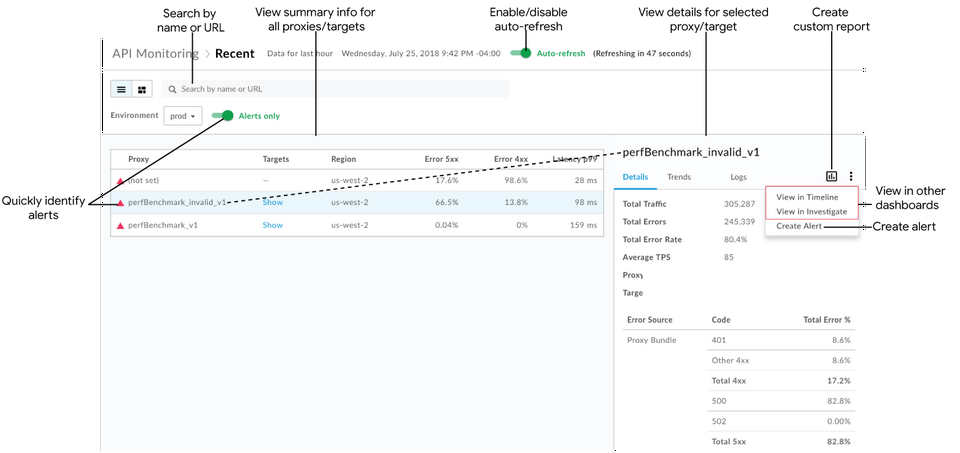
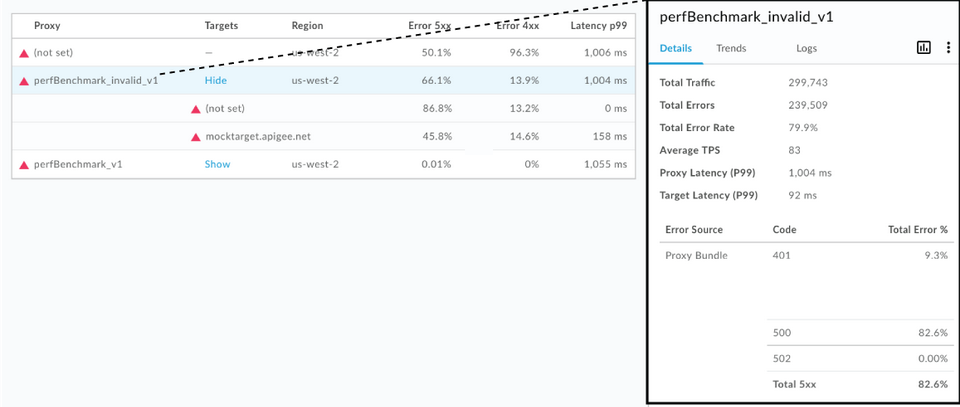
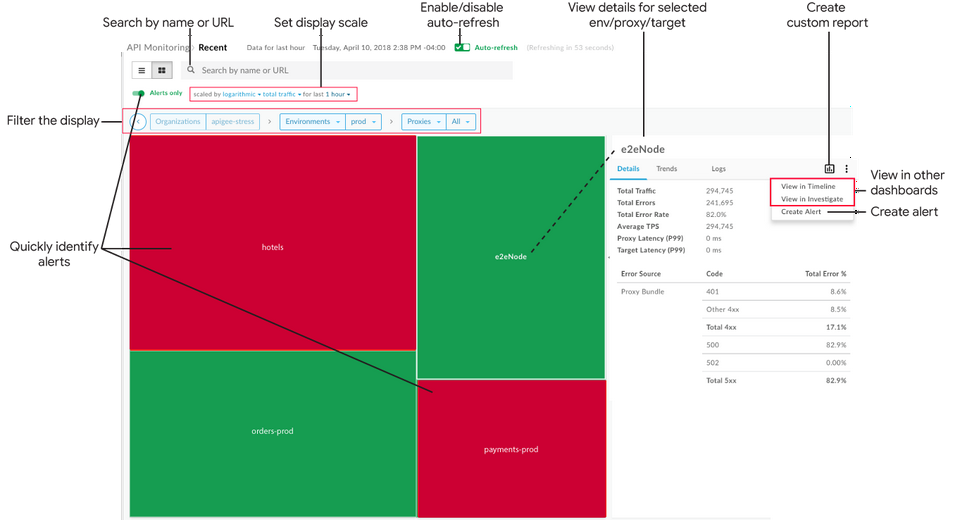
As highlighted in the figure, the List view enables you to:
- View summary information for all API proxies and target services in your organization that have had transactions in the last hour. API proxies and target services are listed by region and environment. (For a broader historical view, see Identify trends in your API monitoring data.)
- Quickly identify API proxies and target services that have alerts. (See Set up alerts and notifications for information about setting up alerts.)
- Click the name of an API proxy or target service in the list to view detailed data in the right pane.
Using the current context, quickly perform the following tasks (options are grayed out if they are not applicable to the currently selected context):
- Create a custom report and add additional dimensions. Click
 .
. - Create an alert and add additional alert conditions, set up notifications, and generate a custom report based on the alert.
- View the current context in the Timeline or Investigate dashboard. Click
 > View in Timeline or View in Investigate, respectively.
- Create a custom report and add additional dimensions. Click
Search the List view by name or URL (such as, https://acme.com/api). Enter all or part of a relevant string in the search box. You can search for content in the Proxy, Targets, or Region fields.
Note: If the Alerts only filter is selected, only the API proxies or target services that have alerts will be listed in the search results.
Enable or disable auto-refresh of the page, as required.
Show and hide target service details in the list.
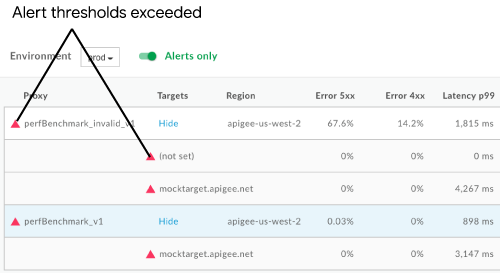
Identify the API proxies and target services that have alerts
When viewing the List view, a red warning icon ![]() and red left border line indicate which API proxies and target services have alerts.
and red left border line indicate which API proxies and target services have alerts.
Click Alerts only to display only the API proxies or service targets that have alerts.
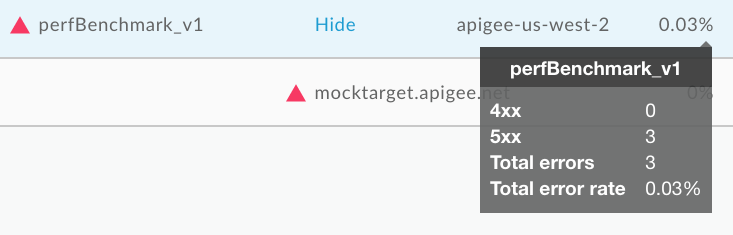
To view an at-a-glance summary of the number of 4xx and 5xx errors, and the overall error rate, hover your mouse pointer over any of the numeric values in the table.
View detailed data for an API proxy or target service
To view detailed data for an API proxy or target service, click its name in the List view. The detailed data displays in the right-hand pane.
Click the following tabs to view more information:
In addition, using the current context, you can quickly perform the following tasks:
Note: Options are grayed out if they are not applicable to the currently selected context.
- Create a custom report and add additional dimensions. Click .
- Create an alert and add additional alert conditions, set up notifications, and generate a custom report based on the alert. Click > Create Alert.
- View the current context in the Timeline or Investigate dashboard. Click > View in Timeline or View in Investigate, respectively.
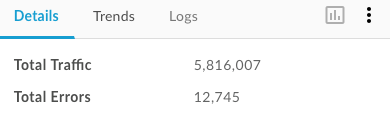
Details
The Details tab provides a quick view of traffic data for the specified timeline (shown in the previous figure), including:
| Details | Description |
| Total Traffic | Total number of transactions. |
| Total Errors | Total number of errors. |
| Total Error Rate | Percentage of traffic that resulted in errors (Total Errors/Total Traffic).
Note: API Monitoring compares this percentage to the alert conditions that you set. If the total error rate exceeds the thresholds, alert indicators are displayed in the UI. |
| Average TPS | Average transactions per second. |
| Total Latency (P99) | Total response latency value in the 99th percentile calculated over a 5-minute rolling window. Note: Shown for API proxies only. |
| Target Latency (P99) | Target response latency value in the 99th percentile calculated over a 5-minute rolling window. Note: Shown for API proxies only. |
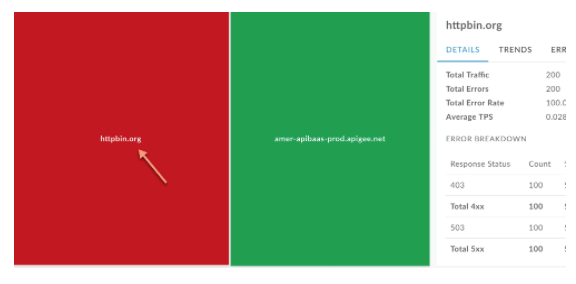
| Error Source | Breakdown and total percentage of API proxy bundle errors (4xx and 5xx) that occurred. |
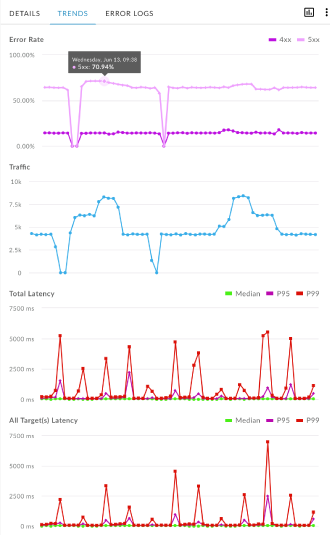
Trends
The Trends tab displays the following graphs for the selected component:
- Error Rate for 4xx and 5xx errors
- Traffic (TPS)
- Total Latency (ms)
All Target(s) Latency
Hover over different points on the graph to display at-a-glance error percentages, total traffic counts, and latencies, respectively, at each point.
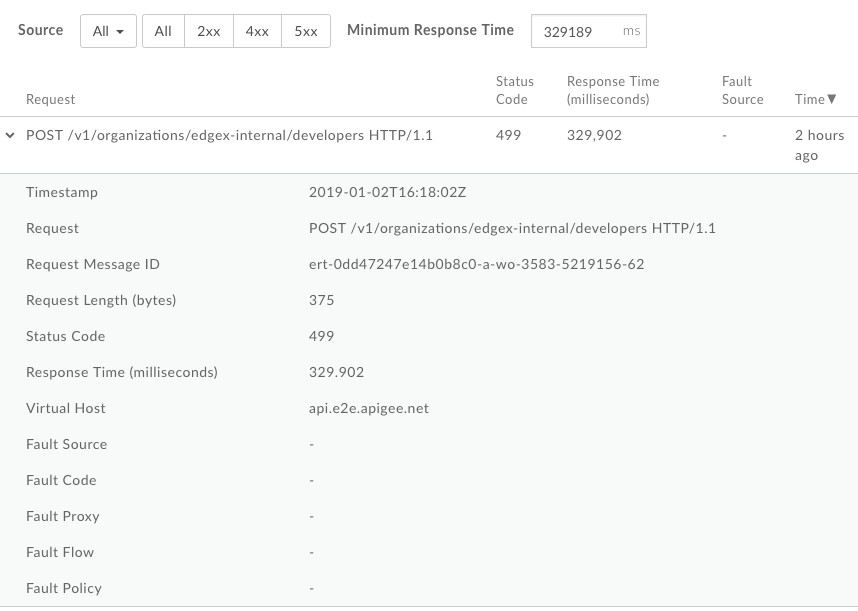
Logs
In the Logs tab, filter by 4xx, 5xx, or All errors, and narrow the source of errors by the API proxy, target service (your service), or Apigee (Apigee infrastructure).
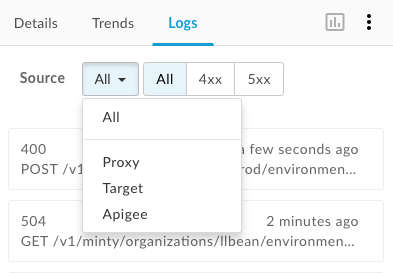
Click an error to open the logs dialog and expand its details in the list.
Use the Heat Map
The Heat Map provides a color block view that enables you to identify which environments have alerts.
- Green indicates that alert condition thresholds have not been exceeded.
- Red indicates alert condition thresholds have been exceeded and alerts have been triggered.
Exploring the heat map
Click ![]() on the Recent page to display the Heat Map, shown in the following figure.
on the Recent page to display the Heat Map, shown in the following figure.
As shown in the previous figure, the Heat Map enables you to:
- Quickly Identify the API proxies and target services that have alerts. (See Setting up alerts and notifications for information about setting up alerts.)
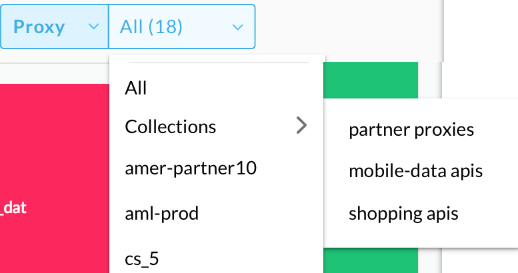
- Filter the display by selecting components from the drop-down lists or double-clicking a box to drill down further. In the Proxies and Targets drop-down lists, you can filter using a collection. For example:
- Click a block in the heat map to view detailed data in the right pane.
Using the current context, quickly perform the following tasks (Options are grayed out if they are not applicable to the currently selected context):
- Create a custom report and add additional dimensions. Click .
- Create an alert and add additional alert conditions, set up notifications, and generate a custom report based on the alert. Click > Create Alert.
- View the current context in the Timeline or Investigate dashboard. Click > View in Timeline or View in Investigate, respectively.
- Create a custom report and add additional dimensions. Click
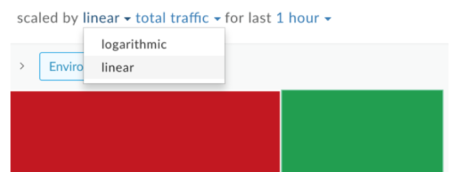
Set the heat map display scale by setting scaled by to logarithmic or linear. Linear sizes the boxes according to overall traffic ratios. For example, a proxy with 200 calls is twice the size of a proxy with 100 calls.
Search the Heat Map by entering all or part of a relevant string in the search box. You can search content in the region, environment, proxy, or target maps, depending on what is currently displayed.
Note: If the Alerts only filter is selected, only the API proxies or target services that have alerts will be listed in the search results.
Enable or disable auto-refresh of the page, as required.
Identify the API proxies and target services that have alerts
When viewing the Heat Map, a red block indicates which environments, API proxies, and target services have alerts. For more information about setting up alerts, see Setting up alerts and notifications.
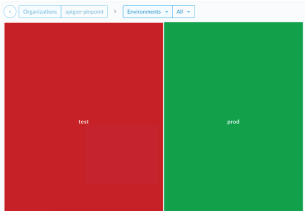
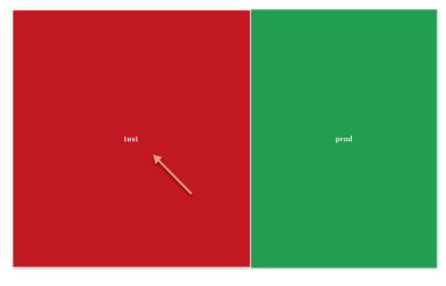
For example, the following figure shows two environments:
- test environment is red because its traffic error percentages have exceeded the alert condition threshold you set for the specified timeline.
- prod environment is green because its traffic errors percentages have not exceeded the alert condition threshold for the specified timeline.
Filter the display by selecting components from the drop-down lists. Or double-click a box to drill down from the environment map to an API proxy map, and from an API proxy map to the service targets map for that API proxy to identify the API proxies and target services that have alerts.
| Environment >> | Proxy >> | Target |
|
 |
 |
Click Alerts only to display only the environments, API proxies, or service targets that have alerts, depending on what is currently displayed.
To navigate back up a level, click ![]() .
.
View detailed data for an environment, API proxy, or target service
To view detailed data for an environment, API proxy, or target service, click the corresponding box in the Heat Map. The detailed data displays in the right-hand pane.
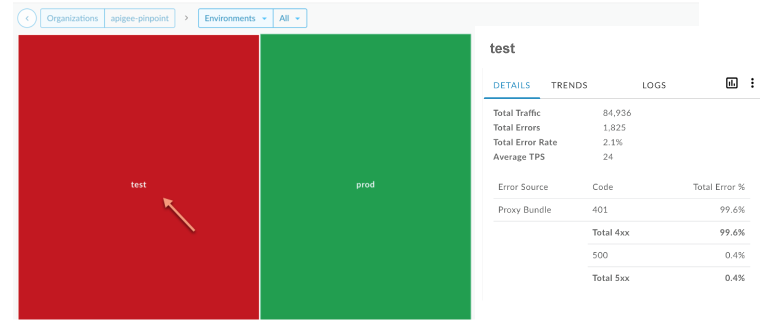
The tabs provide the same information that is provided in the List view. For more information, see:
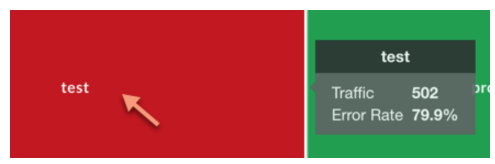
Clicking a box in the map also displays at-a-glance the number of calls and the error rate over the last hour.
Create a custom report from the Recent dashboard
Create a custom report based on the selected set of conditions. You can edit the custom report after it is created, to add or delete metrics and dimensions, as required. For example, you may wish to narrow your investigation to a particular access token, developer app, or API proxy. For more information, see Analytics metrics, dimensions, and filters reference.
For more information, see Creating custom reports.
To create a custom report from the Recent dashboard:
- Click Analyze > API Monitoring > Recent in the Edge UI.
Select an API proxy or target service in the List View or Heat Map filter drop-downs to view more details. Note: Custom reports are not available if the Proxies and Targets filters are set to
All.In the right corner, click
.
The custom report page displays in a new tab with relevant fields pre-populated and default dimensions and metrics. By default, the custom report is named as follows:
API Monitoring Recent GeneratedNote: If a custom report already exists for the current context, it is opened.Edit the custom report, as desired, and click Save.
Click the name of the report on the list and run the custom report.