
You're viewing Apigee Edge documentation.
Go to the
Apigee X documentation. info
Step through a sample scenario that demonstrates how to troubleshoot 5xx issues with your APIs.
| # | Step | Description |
|---|---|---|
| 1 | Monitor recent API traffic | View the recent API monitoring data for all API proxies and targets that have had traffic in the last hour. Drill down on API proxies or targets with a high error % rate. |
| 2 | Identify trends in your API monitoring data | Access an historical view of your API monitoring data up to the last 3 months to gain a broader perspective. |
| 3 | Investigate 5xx issues | View the fault codes that are experiencing the highest relative volumes over time to further investigate the source of the 5xx issues. (Typically, 5xx status codes can be classified using one or more fault codes.) |
| 4 | Set up a 5xx alert | Set up an alert to be notified when the number of 5xx status codes exceeds a particular threshold. |
| 5 | Generate a custom report with client details (Optional) | Optionally generate a custom report to identify details about the client that is triggering the 5xx errors. Note: You must be an organization administrator to generate a custom report. |
| 6 | Group API proxies into a collection | Create a collection to group API proxies and set up appropriate alert threshold values for all members of the group to diagnose issues faster.
|
| 7 | Resolve the 5xx issues | Based on your investigation and diagnosis, take appropriate actions to resolve the 5xx issues. |
Step 1: Monitor recent API traffic
To view API monitoring data for the API proxies and targets that have had traffic over the last hour:
- Select Analyze > API Monitoring > Recent in the Edge UI to access the Recent dashboard.
Notice the API proxies and targets that have had a high error % rate over the last hour.
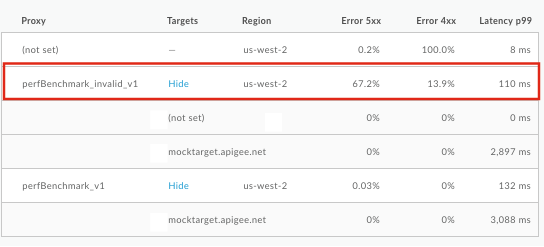
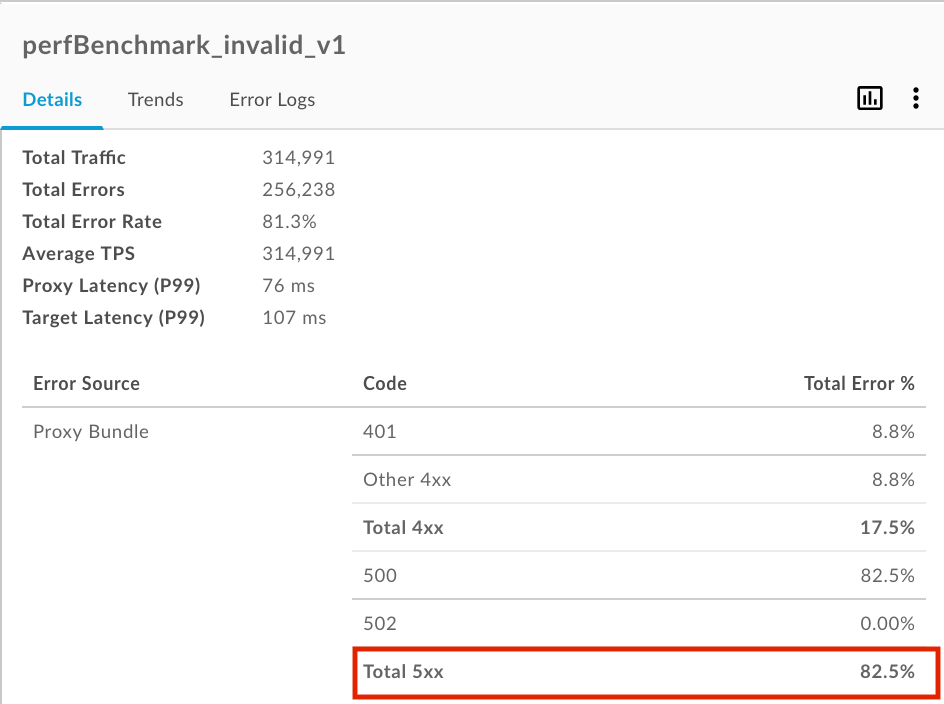
Click the API proxy or target with a high error % rate to view details in the right pane. Notice the high percentage of 5xx errors in this example.
For more information about this step, see Monitor recent API traffic.
Step 2: Identify trends in your API monitoring data
To access an historical view of API monitoring data for the API proxies and targets that have had traffic up to the last three months:
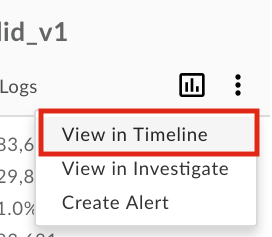
- In the right pane of the Recent dashboard, select
 > View in Timeline to access the Timeline dashboard.
Alternatively, you can click Analyze > API Monitoring > Timeline in the Edge UI.
> View in Timeline to access the Timeline dashboard.
Alternatively, you can click Analyze > API Monitoring > Timeline in the Edge UI.
- View the trend for the API proxy or target over time. Notice that the trend has been consistent over the last 7 days.
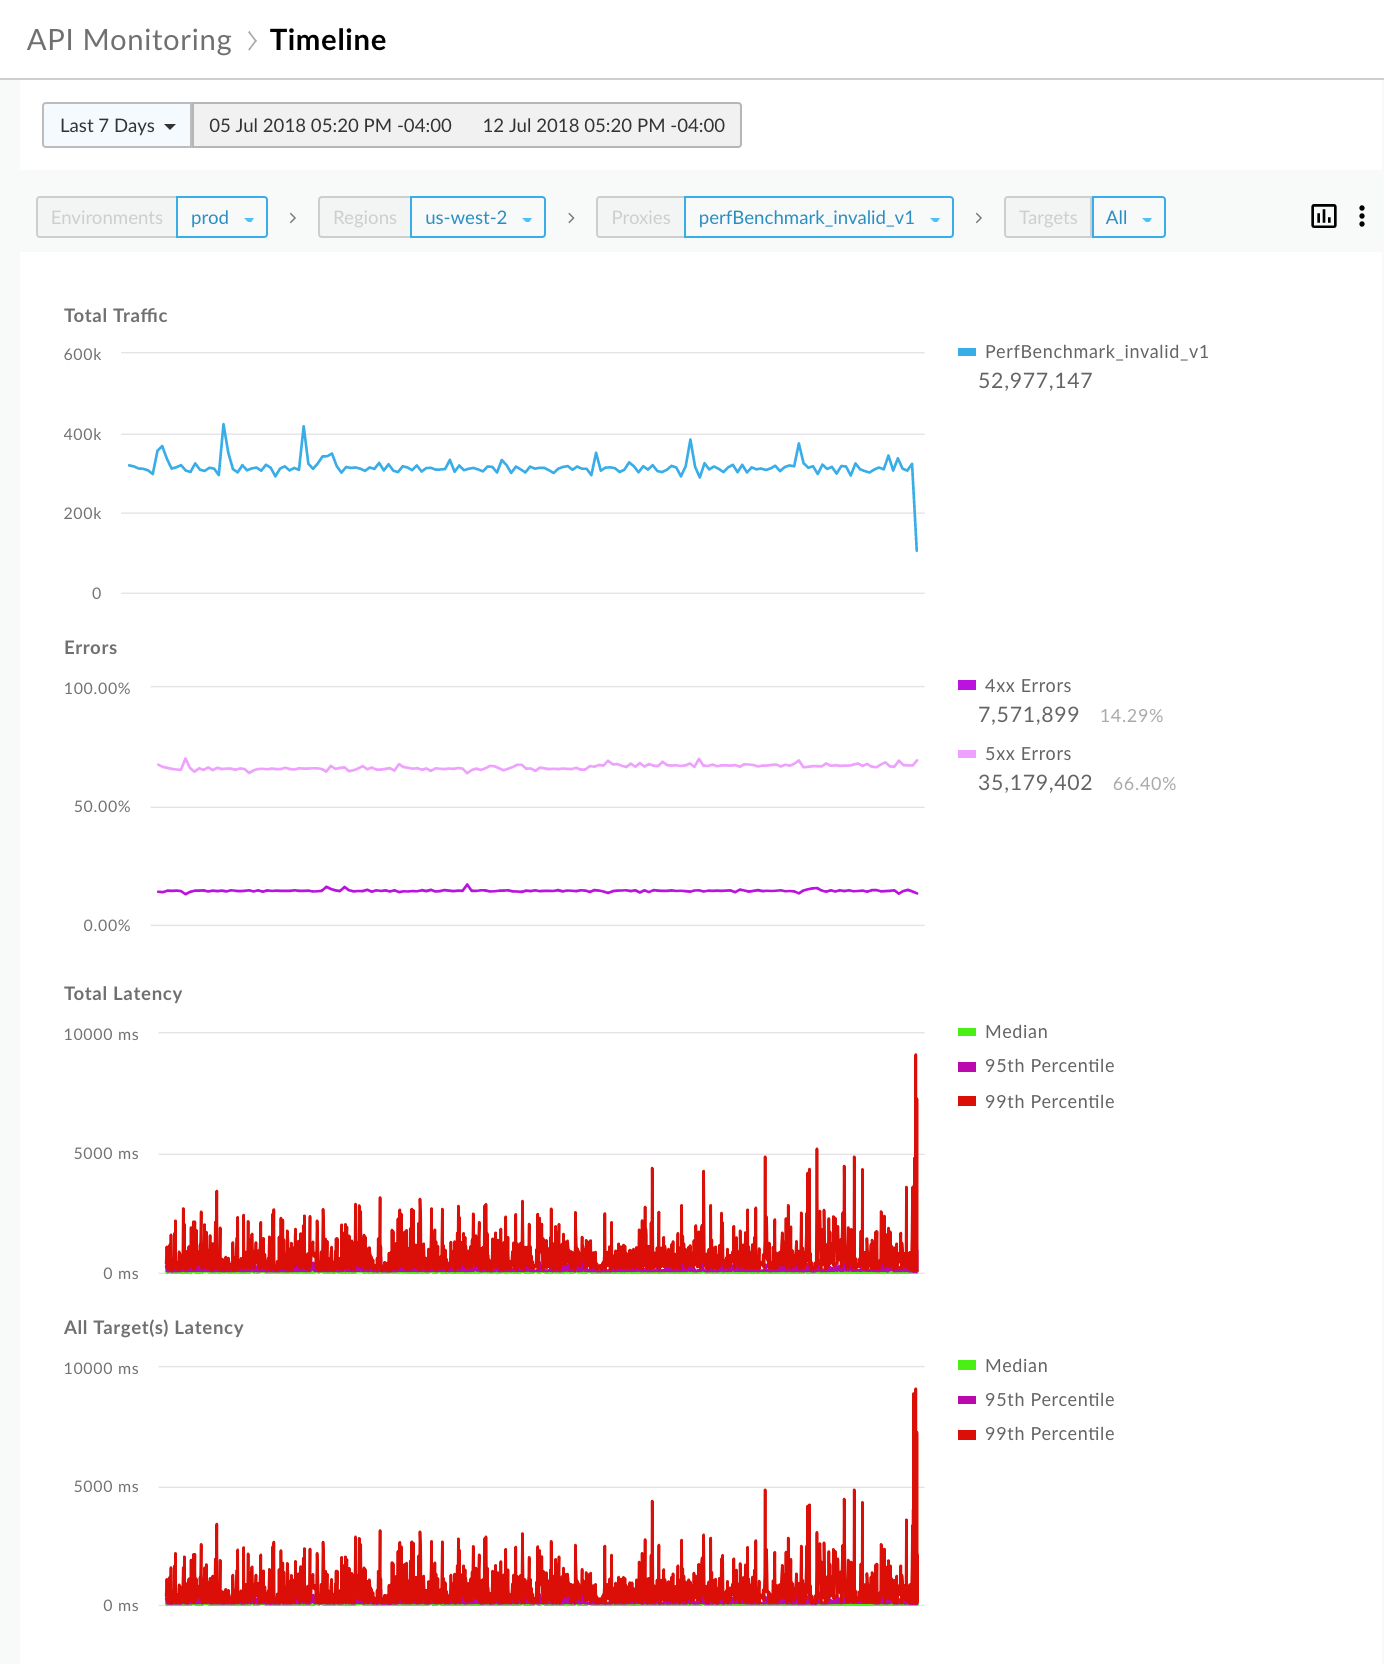
For more information about this step, see Identify trends in your API monitoring data.
Step 3: Investigate 5xx issues
Apigee provides a set of fault codes that help you to diagnose issues. Typically, 5xx status codes can be classified using one or more fault codes.
To investigate 5xx issues:
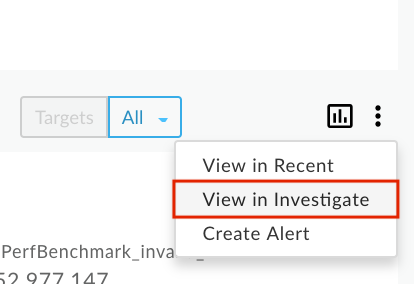
- In the right pane of the Timeline dashboard, select > View in Investigate to access the Investigate dashboard.
Alternatively, you can click Analyze > API Monitoring > Investigate in the Edge UI.
The Investigate dashboard enables you to compare relational activity between metrics, such as fault code versus time. View the fault code versus time matrix to view the fault code activity over the last hour. Notice the fault codes that are experiencing the highest relative volumes based on the color shading of a block. The darker the block, the higher the relative volume.
For example, the
policies.ratelimit.SpikeArrestViolationandpolicies.ratelimit.QuotaViolationfault codes are showing a higher relative volume in the following matrix: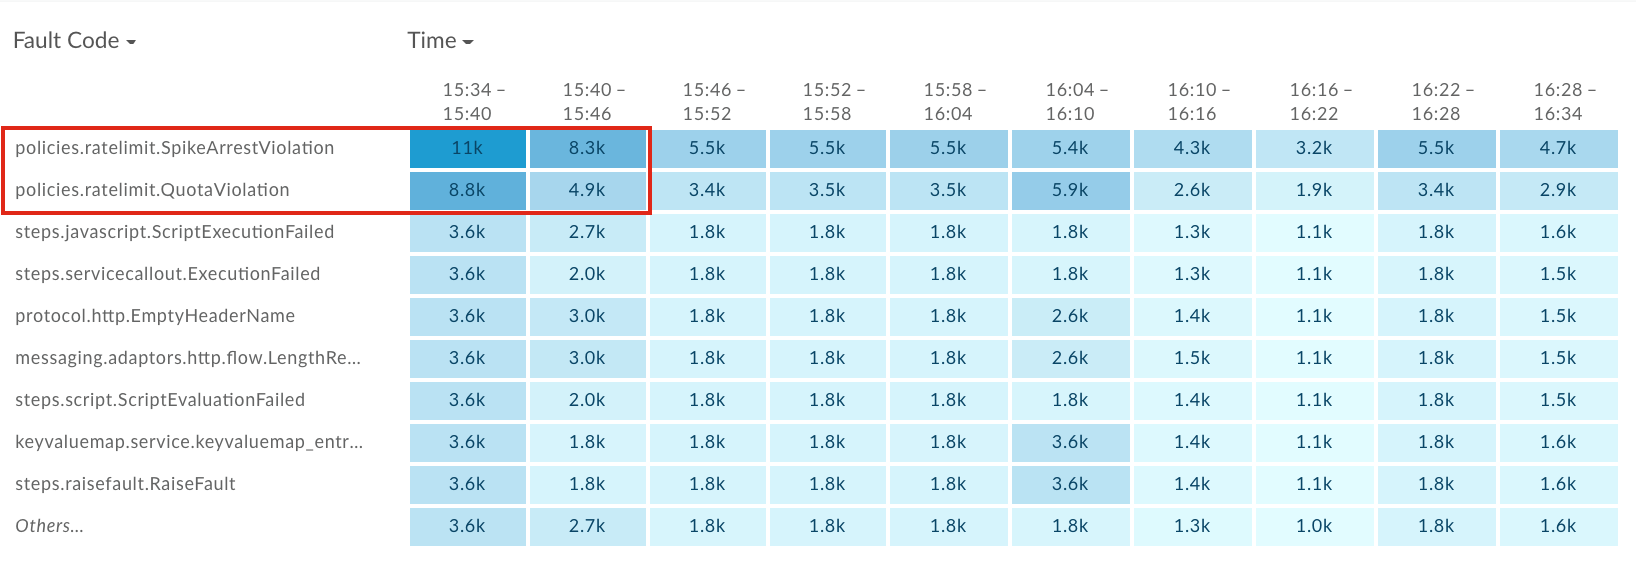
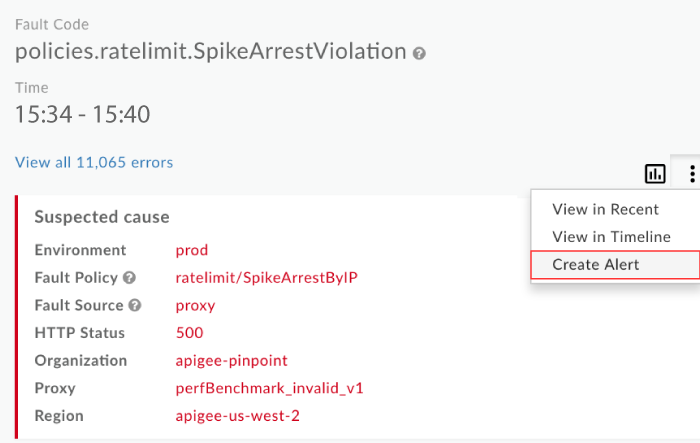
Click the darkest block (first block) in the
policies.ratelimit.SpikeArrestViolationrow to view more details in the right pane.
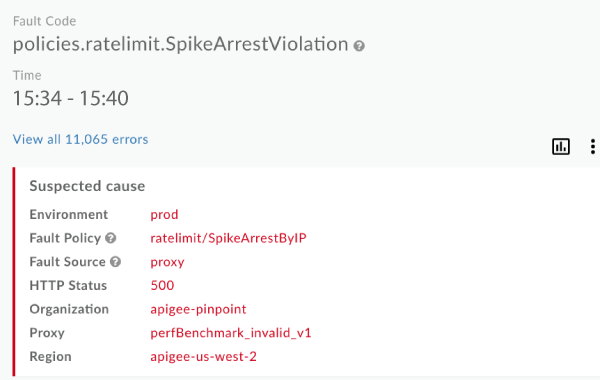
Notice that the fault source is the perfBenchmark_invalid_v1 API proxy and the HTTP Status code is 500. A 500 status code is a common runtime error code for Spike Arrest policy violations.
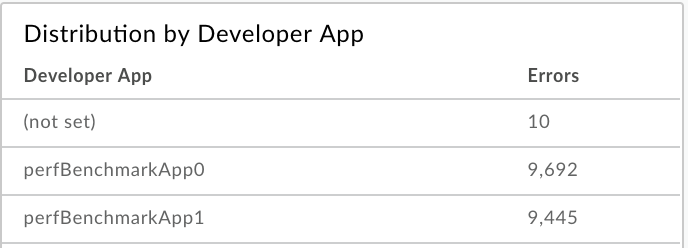
View the Distribution by Developer App, just below the Suspected cause panel, to identify the developer apps with the highest error rates.
For more information about this step, see Identify issues.
Step 4: Set up 5xx alert
Set up an alert based on the selected context in the Investigate details pane to be notified when the number of 5xx status codes exceeds a specific threshold.
In the right pane of the Investigate dashboard, select
> Create Alert.
Complete the fields in the alert dialog. The condition fields are pre-populated with data from the current context. For example:
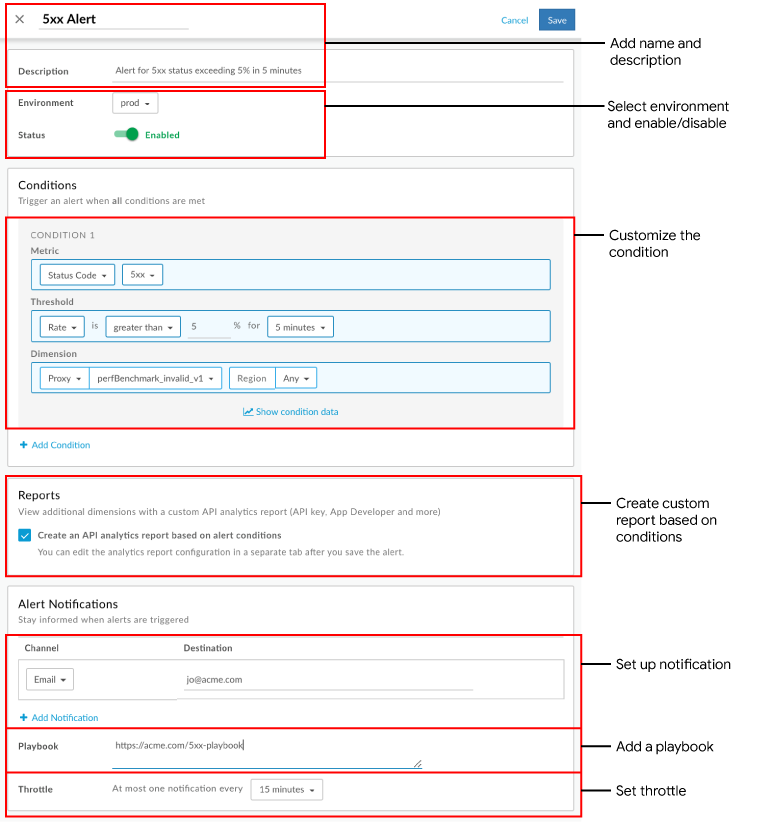
Click Save.
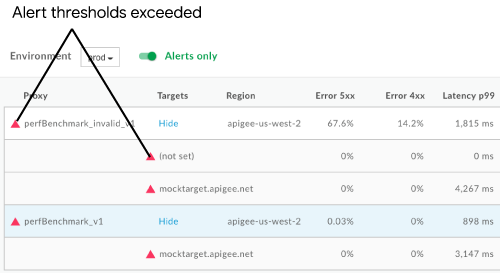
In the future, when the 5xx error rate exceeds 5% for a period of 5 minutes for the perfBenchmark_invalid_v1 API proxy, a notification is sent to the specified email and a visual alert is displayed in the UI. For example:
For more information about this step, see Set up alerts and notifications.
Step 5: Generate a custom report with client details (Optional)
Optionally, generate a custom report to identify more details about the client that is triggering the 5xx errors.
On the Reports page, custom reports that are created based on an alert are named using the following format: API Monitoring Generated: alert-name.
Access the custom report created when setting up the alert in one of the following ways:
Select Analyze > Custom Reports > Reports in the left navigation bar to display the Reports page. Click the name of the report in the list: API Monitoring Generated: 5xx Alert
Click within the notification that is displayed when the alert is created. For example:

Add the following dimensions:
- Developer App
- Client ID
- Client IP Address
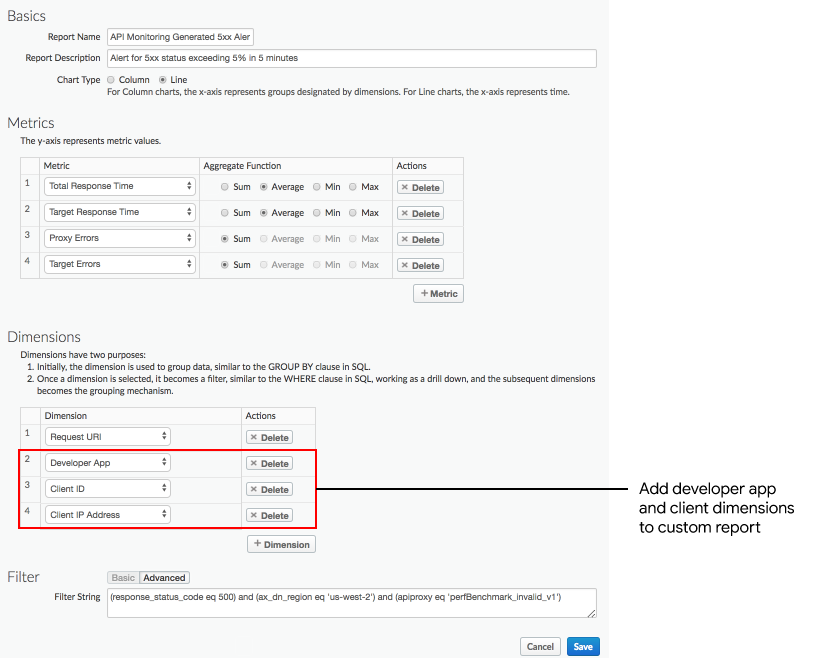
To view a report based on a specific developer app with a high error rate, add a filter similar to the following:
and (developer_app eq 'perfBenchmarkApp0')Note: In this case, remove Developer App from the list of dimensions.
Click Save.
Run the report to view details about the developer app and clients that are triggering the 5xx status code.
For more information about this step, see Create custom reports.
Step 6: Group API proxies into a collection
Create a collection to group API proxies and set up appropriate alert threshold values for all members of the group to diagnose issues faster.
- Select Analyze > API Monitoring > Collections in the Edge UI to display the Collections dashboard.
- Click + Collection.
- Select Proxy.
- Select the prod from the environment drop-down.
- Click Next.
- Complete the fields in the collection dialog.
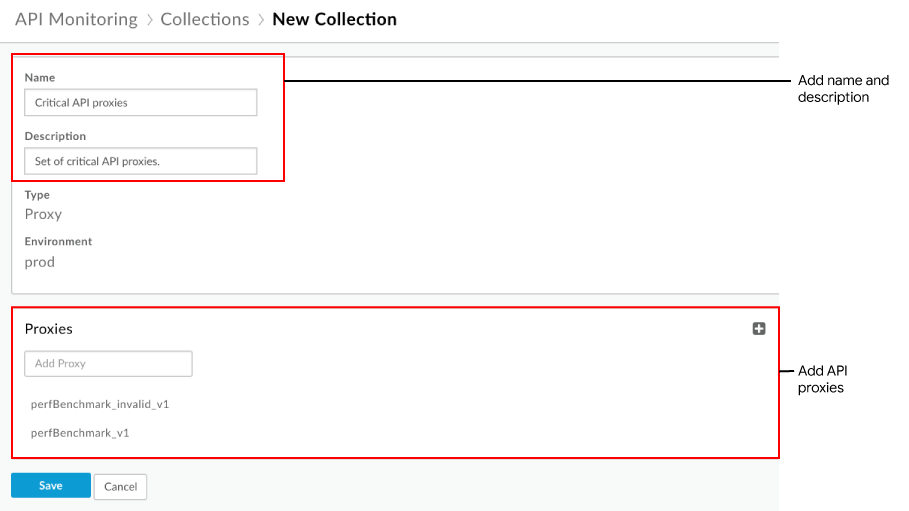
- Click Save
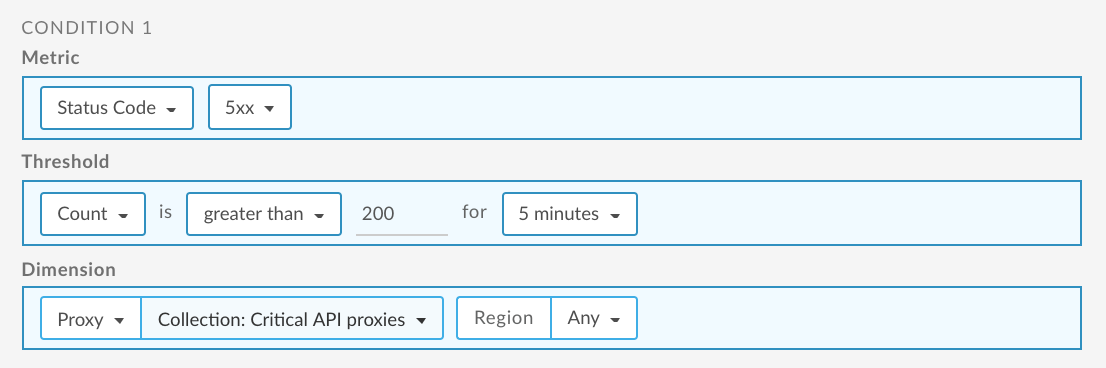
Next, you can set up an alert, similar to step 4, and set the dimension to the collection that you defined above.
For more information about this step, see Manage collections.
Step 7: Resolve the 5xx issues
Take the appropriate actions to resolve the 5xx issues. For example, based on your diagnosis you might perform one of the following tasks:
- Use Apigee Sense to determine if the spike in requests is suspicious and decide you want to block the client IP address identified in the custom report.
- Add a quota policy to limit the number of connections developer apps can make to your API proxy over a specific period of time.
- Monetize your API to charge developers for usage over a certain number of calls.