You're viewing Apigee Edge documentation.
Go to the
Apigee X documentation. info
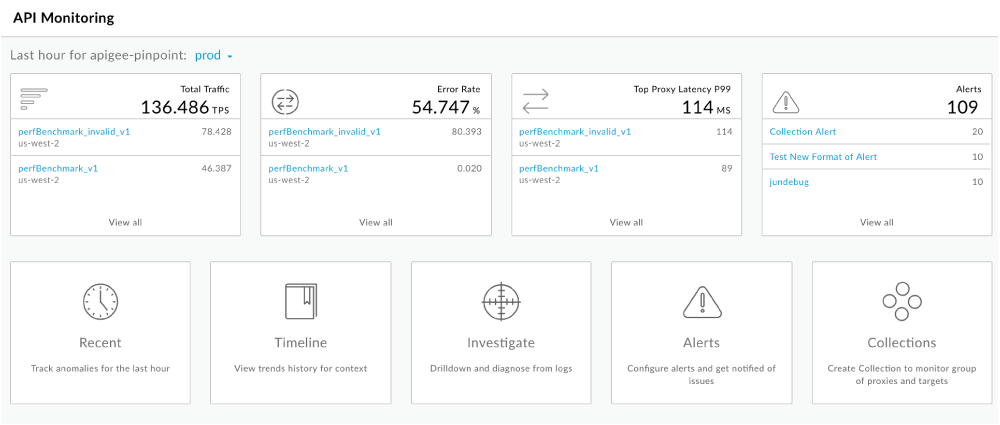
When you access API Monitoring, the API monitoring dashboard displays a summary view of API monitoring for all API proxies deployed to the selected environment in your organization.

The top row on the API monitoring dashboard provides summary information for the last hour in key areas for all API proxies that are deployed to the selected environment in your organization, including:
- Total traffic in transactions per second (TPS)
- Average error rate percentage
- Top API proxy response latency value in the 99th percentile (not a total or average)
- Total number of alerts
Up to three API proxies with the highest values for each metric are listed below the summary information. Click the name of an API proxy to display more details or click View All to view summary details for all API proxies.
In the bottom row, click a tile to perform the following tasks:
| Task | Description | More information |
|---|---|---|
| Recent | Monitor recent API traffic information, refreshed every 60 seconds. Isolate problem areas quickly to diagnose error, performance, and latency issues. | Monitor recent API traffic |
| Timeline | View an historical timeline of your API transactions over the last hour up to 3 months to identify trends. | Identify trends in your API monitoring data |
| Investigate | View pivot tables of metrics and attributes for all API traffic up to the last four hours to diagnose issues faster. | Investigate issues |
| Alerts | Set up alert conditions to define status code, latency, and fault code thresholds. Send notifications when alerts are triggered through a variety of channels, such as email, PagerDuty, or Slack. | Set up alerts and notifications |
| Collections | Group API proxies or targets and set up appropriate threshold values for all members of the group to diagnose issues faster. | Manage collections |
