
You're viewing Apigee Edge documentation.
Go to the
Apigee X documentation. info
The Investigate dashboard enables you to view pivot tables of metrics and attributes for all API traffic and compare relational activity between metrics to investigate and diagnose issues faster. You can access data for the past 30 days in the dashboard.
Select Analyze > API Monitoring > Investigate in the Edge UI to open the Investivate dashboard. The dashboard has two main areas:
- Status Code lets you investigate status code metrics for API proxies and target services.
- Latency lets you investigate latency issues for API proxies and target services.
You can also investigate issues caused by a specific alert in the Investigate dashboard. When an alert occurs, click the name of the alert in the Alert History page to open the alert in the Invesitgate dashboard.
Use the Investigate dashboard to diagnose an issue
For example, you receive an alert that indicates that the 5xx error rate exceeds the specified threshold. To investigate this issue, you might perform the following tasks on the Investigate dashboard:
- View the fault code versus time matrix to view the fault code activity over the last hour.
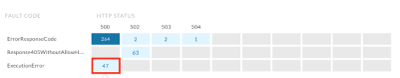
- Switch to the fault code versus HTTP status matrix to identify specific HTTP status codes associated with the fault codes whose counts have increased over the last hour, as identified in the previous step.
- Switch to the fault code versus Proxy matrix to identify the API proxies that are triggering the fault codes identified in the previous step.
- Click a box in the matrix that is associated with an API proxy with a high volume of fault codes to view more details and access logs.
- Set up an alert and create a custom report to further assist with diagnosing the issue.
Further troubleshoot the API proxy using trace and other tools to identify a resolution to the issue.
Use the Status Code dashboard
The Status Code dashboard lets you investigate status code metrics for the API proxies and target services in your organization. You can view status code metrics for a one-hour or four-hour window at any time in the past 30 days.
Explore the Status Code dashboard
To display the Status Code dashboard, select Analyze > API Monitoring > Investigate in the Edge UI. The Status Code dashboard displays by default:
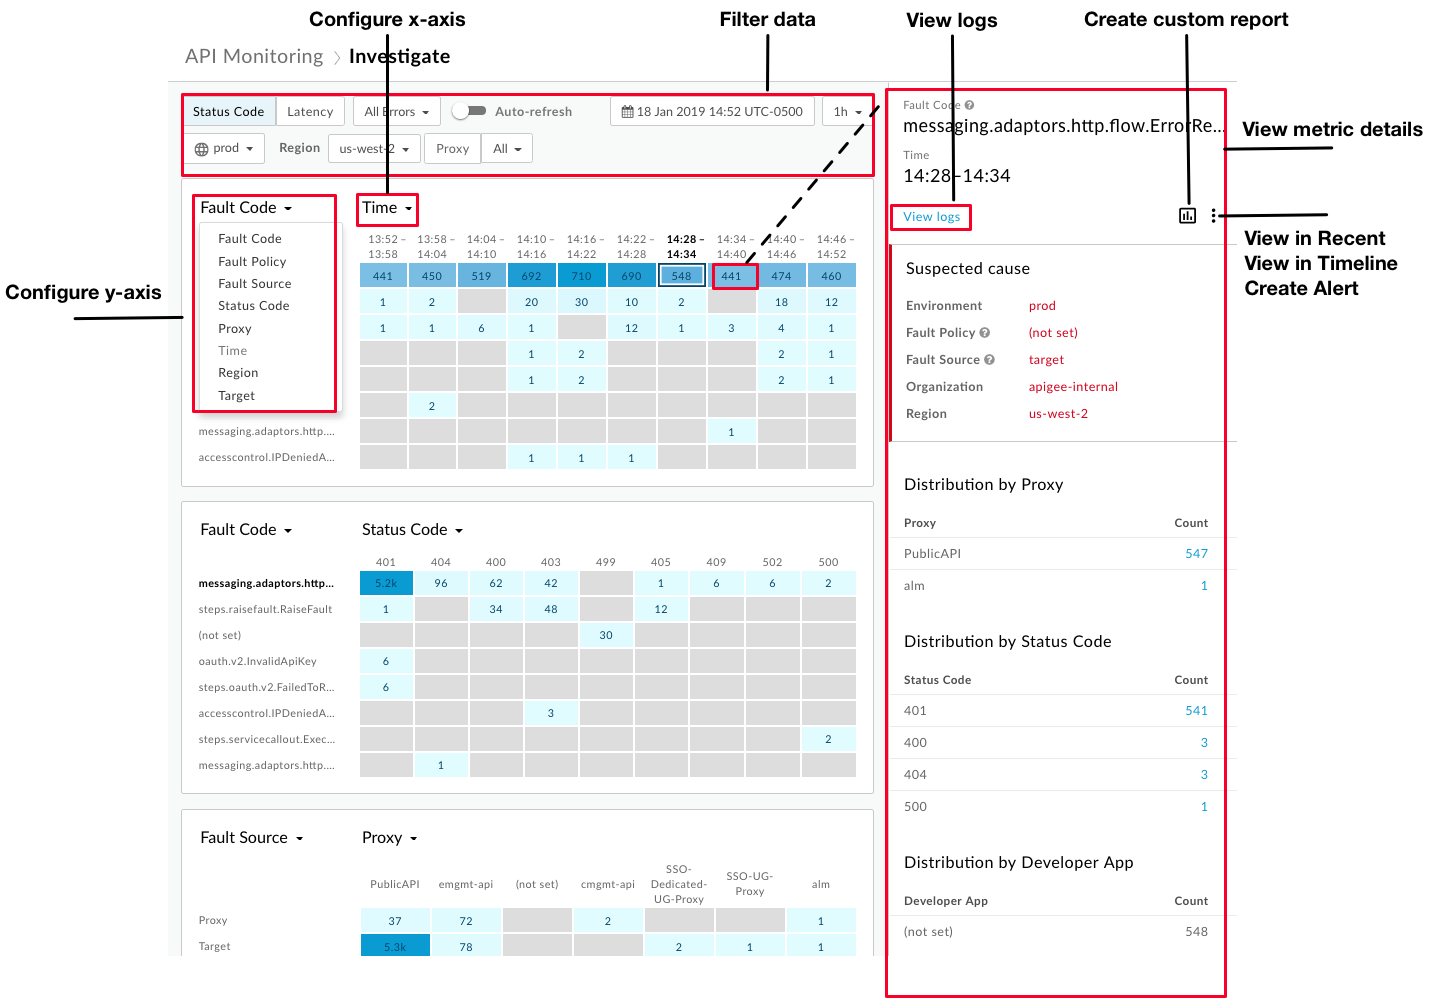
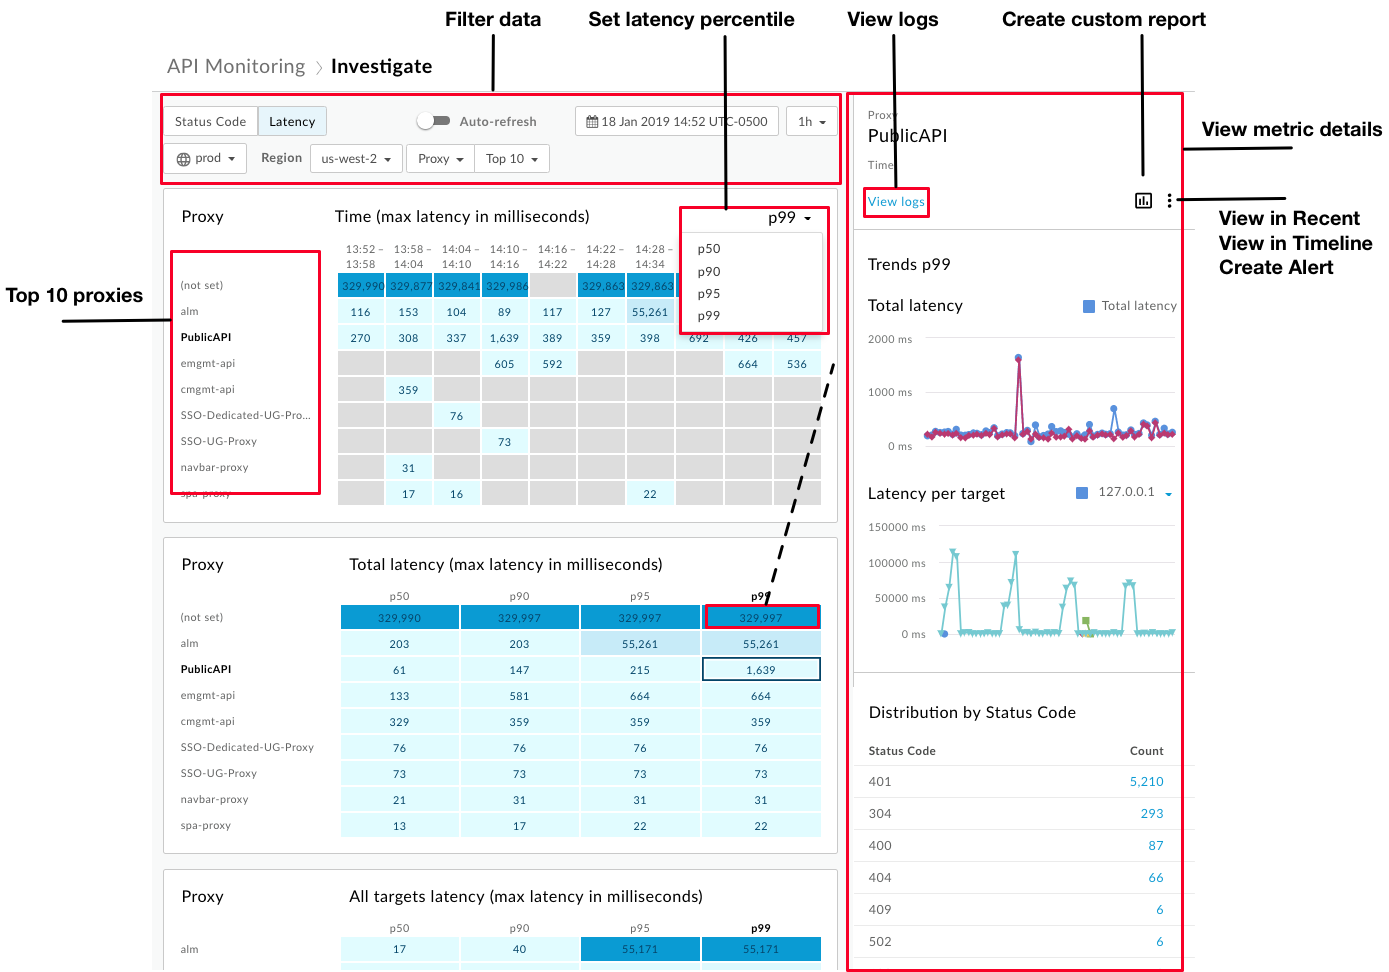
As highlighted in the figure, the Investigate dashboard enables you to:
- Configure each matrix by setting its x-axis and y-axis to compare the relational activity between metrics and gain more insights.
- Quickly identify the metrics that are experiencing the highest relative volumes based on the color shading of a block. The darker the block, the higher the relative volume.
- Click a block in the matrix to view metric details.
- Filter the data based on the following:
- Environment
- Region
- Proxy
- Status codes (including all traffic, all errors, 2xx, 4xx, or 5xx)
- Date and time in the past 30 days
- 1-hour or 4-hour window
Use the dashboard to quickly perform the following tasks:
- Access logs in the metric details panel.
- View the current context in the Recent or Timeline or dashboard by clicking
 > View in Recent or View in Timeline, respectively.
 - Create a custom report and add additional dimensions by clicking
 .
. - Create an alert and add additional alert conditions, set up notifications, and generate a custom report based on the alert.
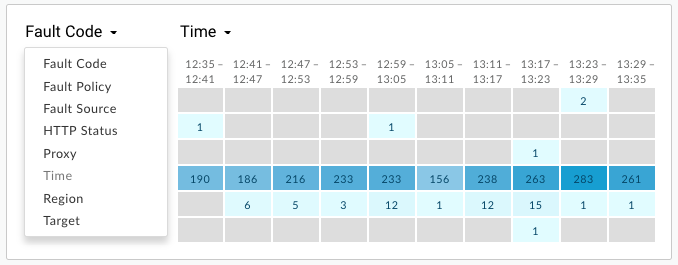
Configure the Status Code matrix
When you select the Status Code dashboard, the following matrices appear by default:
- Fault code versus time
- Fault code versus HTTP status
- Fault source versus API proxy
Configure each matrix to compare any two of the following metrics by selecting a value for the x- and y-axis drop-down lists:
- Fault code
- Fault policy
- Fault source
- HTTP status
- Proxy
- Time
- Region
- Target (Target service or the ServiceCallout policy. If the target is a ServiceCallout policy, then the displayed
value is prefixed by
sc://. For example,sc://my.endpoint.net.)
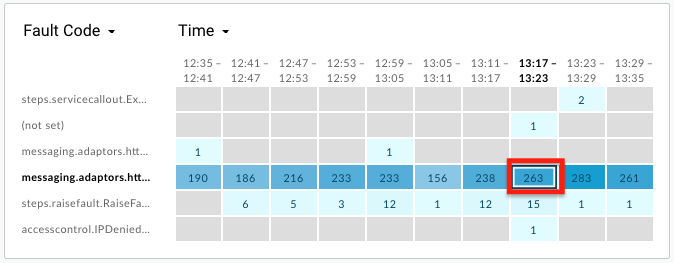
View Status Code metric details
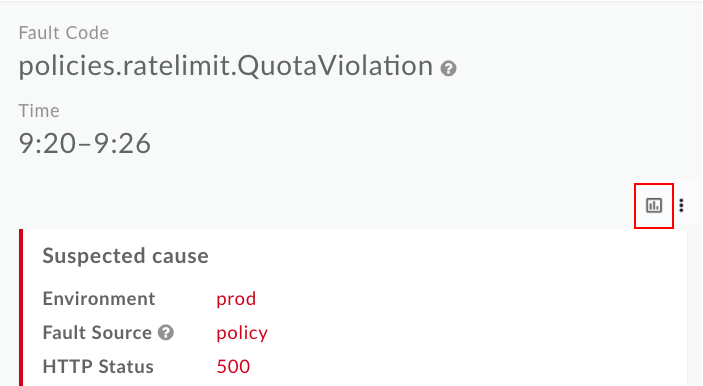
View details for a particular metric by clicking its block in the matrix.
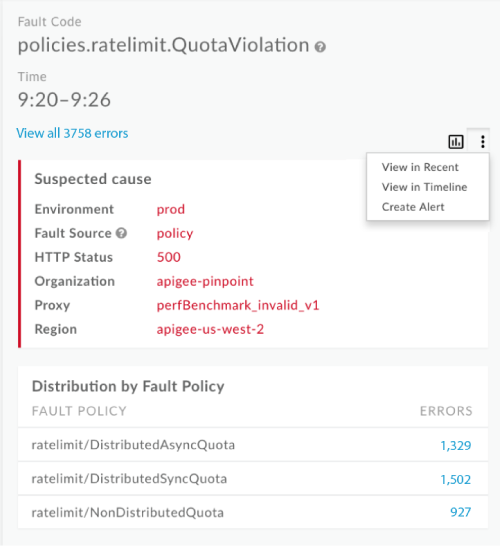
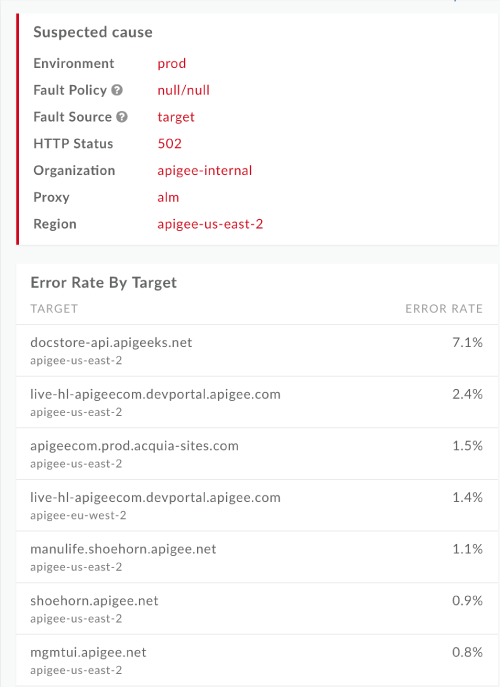
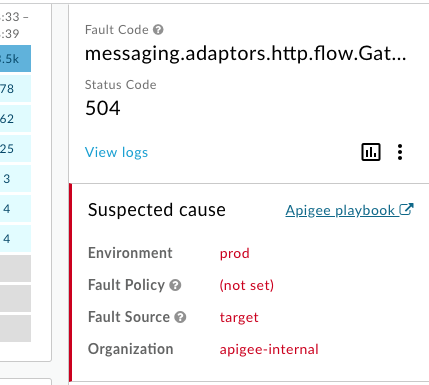
Details pertaining to the suspected cause are displayed in the right pane, including:
- Environment
- Organization
- Region
- Fault Source (proxy, target, or Apigee infrastructure)
Details may also include:
- Fault Policy - Information about the policy that triggered the runtime error, including policy type (internal name) and user-defined policy name. You define the name when attaching the policy to the API proxy flow.
- Proxy name
- HTTP Status code
- Fault Code
If the cardinality is greater than one for a specific metric, the details panel may include error distribution details, such as Distribution by Developer App, Distribution by Fault Policy, Distribution by Fault Code, Distribution by HTTP Status, and so on. For example:
If the fault source is target, the details panel will include Error Rate by Target. For example:
Use the Latency dashboard
The Latency dashboard displays latency information for the API proxies and target services in your organization. You can investigate latency metrics for a one-hour window at any time in the past 30 days.
Explore the Latency dashboard
To display the Latency dashboard, select Analyze > API Monitoring > Investigate in the Edge UI. The Status Code dashboard displays by default. Select Latency in the filter area to display the Latency dashboard.:
When you select the Latency dashboard, the following matrices appear by default:
- Proxy vs Time (max latency in milliseconds)
- Proxy vs Total latency (max latency in milliseconds)
- Proxy vs All targets latency (max latency in milliseconds)
Use the Proxy drop-down box to select Target to view target latencies.
By default, the Latency dashboard shows information for the 10 proxies with the highest total P99 latency for the previous hour. Alternatively, use the Top 10 drop-down box to select a specific proxy or collection.
The Latency dashboard has all of the features of the Status Code dashboard, with the following differences:
- You only configure the total response latency percentile (p50, p90, p95, p99).
- You can only select a one-hour window for latency metrics.
- You cannot select Any for Region in the filters. You must select a specific region to view.
View Latency metric details
View details for a particular metric by clicking its block in the matrix.
Details pertaining to the latency for a proxy (blue line) and target (purple line) are displayed in the right pane, including:
- Total latency (proxy latency plus target latency)
- Latency per target (target response time)
- Distribution by HTTP Status
Hover over the graph to view detailed information:
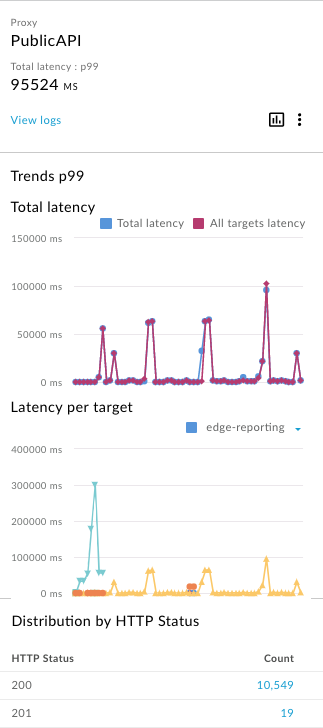
The Latency per target graph shows the top 16 targets based on the maximum latency, with one graph per target. Mouse over a graph or select the dropdown list to determine the graph that corresponds to each target.
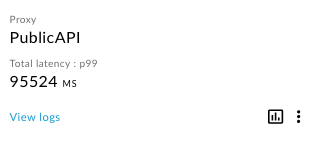
View logs from the metrics details
When viewing metric details for either status codes or latency, click View logs to view all logs for the selected metric:
The Traffic Logs dialog opens and displays a maximum of 1000 log entries. Click a log entry to expand its details in the list:
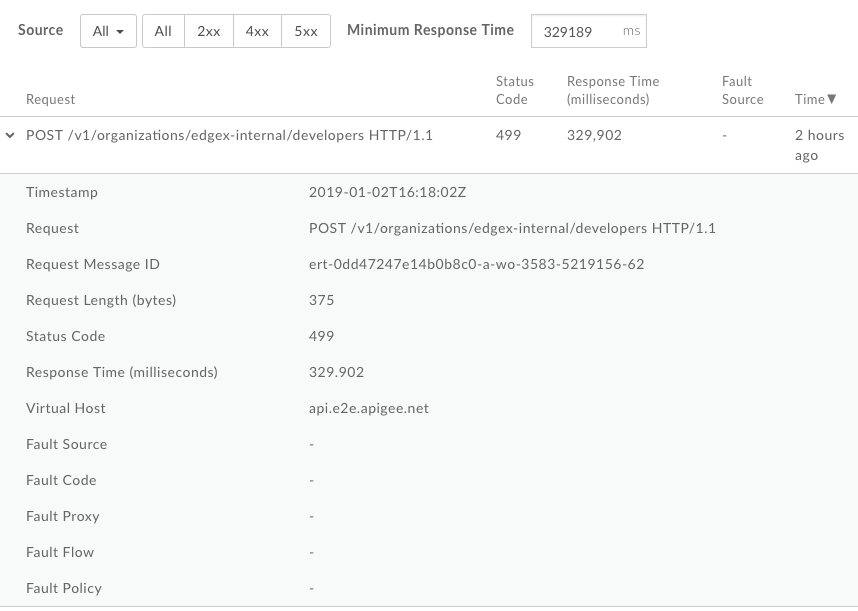
You can further filter the logs by the:
- Traffic source
- Error type
- Minimum response time
You cannot download the logs data from the Traffic Logs dialog. However, you can create a custom report or download the analytics data to your own data repository, such as Google Cloud Storage or BigQuery, to perform your own data analysis.
Create a custom report from the Investigate dashboard
Create a custom report based on the selected set of conditions. You can edit the custom report after it is created, to add or delete metrics and dimensions, as required. For example, you may wish to narrow your investigation to a particular access token, developer app, or API proxy. For more information, see Analytics metrics, dimensions, and filters reference.
For more information, see Creating custom reports.
To create a custom report:
Click a block in the matrix to display more detail.
In the right pane, click
.
The custom report page displays in a new tab with relevant fields pre-populated.
Note: See Creating custom reports for more information about the default custom report settings.
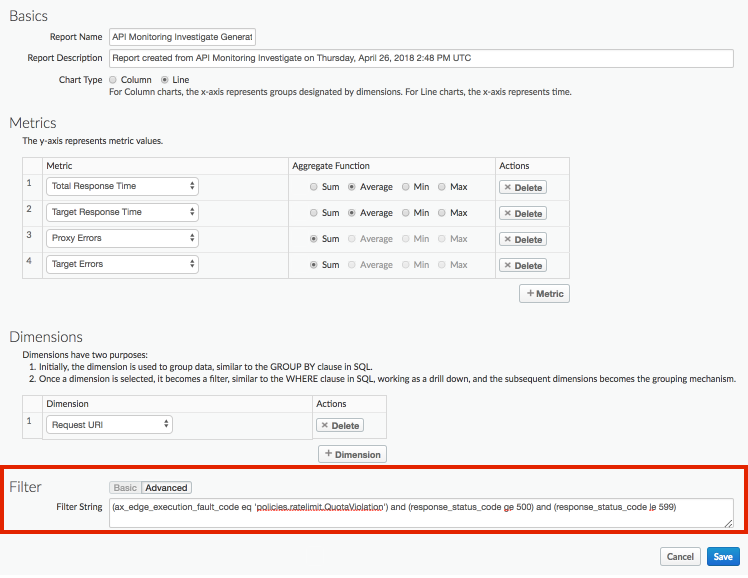
Edit the custom report, as required. See Manage custom reports.
Click Save to save the custom report.
The report is run using the data collected over the last hour by default and the data is displayed in the custom report dashboard. See Exploring the custom reports dashboard.
On the Reports page, custom reports that are generated using API Monitoring are named using the following format: API Monitoring Investigate Generated.
Investigate a specific alert
To investigate a specific alert, select the name of the alert in the Alert History page. The Investigate dashboard appears. Notice that it contains a graph at the top of the dashboard, and only includes information specifc to the alert:
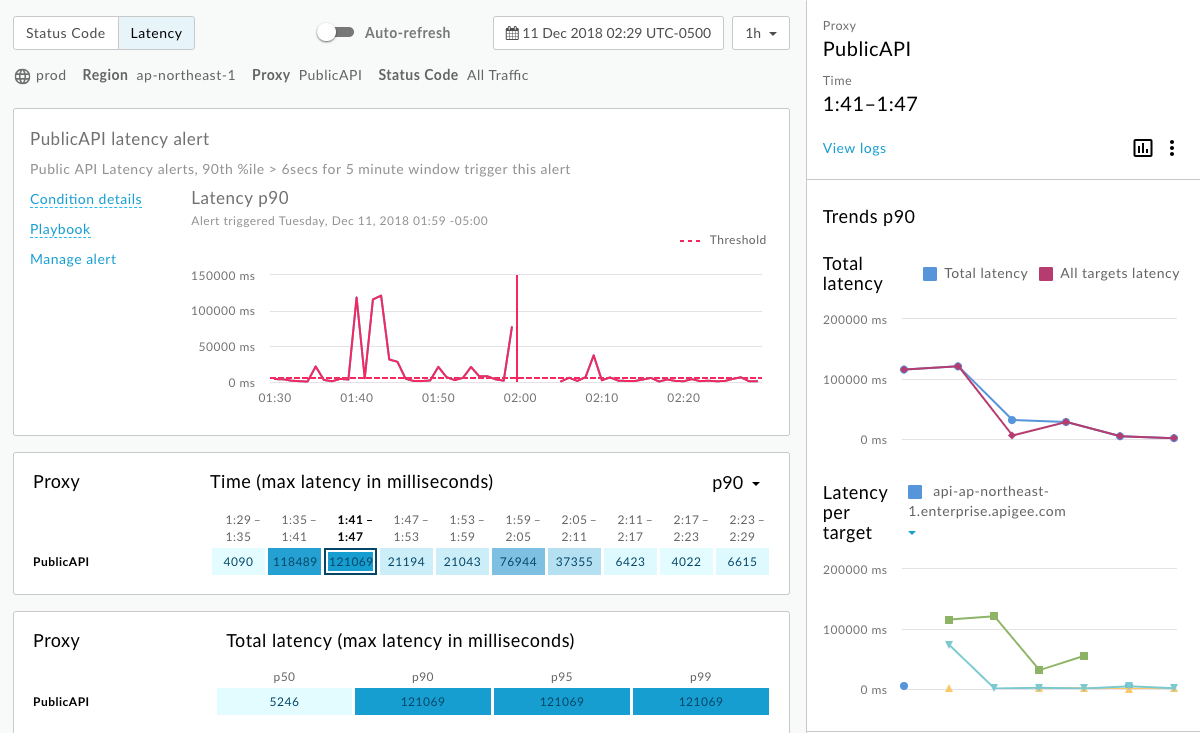
- View API traffic details at the time the alert was triggered.
- View contextual information about the alert, including time that the alert was triggered in the center of the graph.
- Click Condition details to display the details for the alert condition in a pop-up window.
Click Playbook (if available) to view the playbook for the alert:
Click Manage alert to edit the alert.
Click View report (if available) to view a custom report.
Enable or disable auto-refresh of the page, as required.