You're viewing Apigee Edge documentation.
Go to the
Apigee X documentation. info
Custom reports enable you to drill-down into specific API metrics and view the exact data that you want to see. From the API Monitoring dashboards, you can create a custom report with the filter and metrics preset based on the configured conditions at time of creation. In addition, a set of default dimensions and metrics are configured in the report for you.
Create a custom report based on your context
Quickly create custom reports based on your context as summarized in the following table. On the Custom Reports page, custom reports that are created using API Monitoring are named uniquely (by default), as indicated in the table; you can change the name when editing the custom report.
| Custom report context | Default naming convention for custom report |
|---|---|
| Recent dashboard | API Monitoring Recent Generated |
| Timeline dashboard | API Monitoring Timeline Generated |
| Investigate dashboard | API Monitoring Investigate Generated |
| Alert condition | API Monitoring Generated: alert-name |
Default dimension and metrics
The custom report will include the dimensions and metrics listed in the following table for all API Monitoring generated reports, by default.
| Component | Defaults |
|---|---|
| Dimensions | Request URI |
| Metrics |
|
Edit the custom report
As mentioned in the previous section, a predefined set of API Monitoring default dimensions and metrics are preconfigured in custom reports. After it is created, you can edit the custom report to add or delete metrics and dimensions, as required. For example, you might want to narrow your investigation to a particular access token, developer app, API proxy, or request ID.
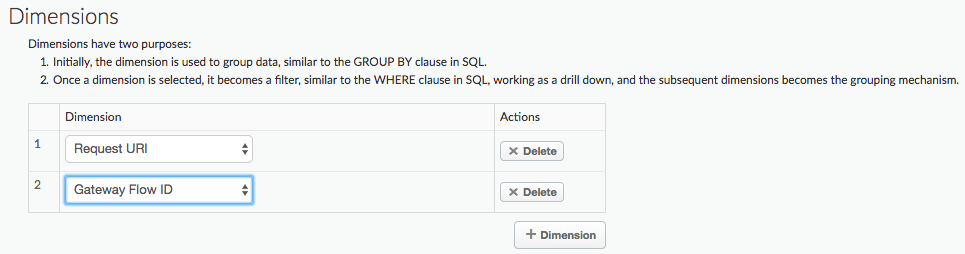
In the following custom report, you add the predefined Gateway Flow ID dimension, where Gateway Flow ID contains the unique UUID of each API request made to Edge.
Note that the report already uses the Request URI dimension:
The following example adds the Client ID dimension to the custom report.
The Client ID dimension contains the consumer key (API key) of the developer
making the API call, whether passed in the request as an API key or included in an OAuth token:
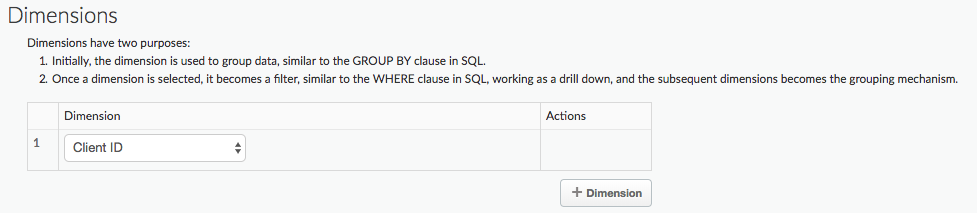
The custom report contains information for all Client ID values.
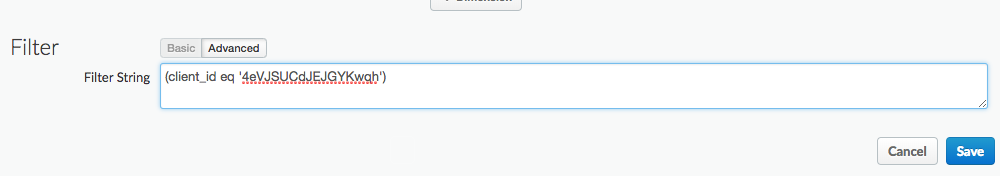
The next example adds a filter so you can create a custom report for a specific Client ID:
For more information on all predefined dimensions and metrics that you can add to a report, see Analytics metrics, dimensions, and filters reference.
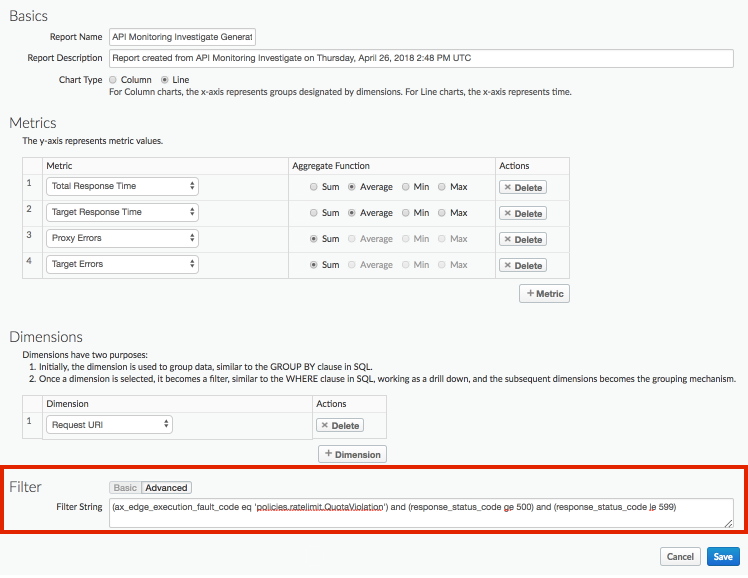
In the next example, you add a Filter to a custom report that captures the default metrics and dimensions for policies.ratelimit.QuotaViolation fault code and 5xx status codes:
For complete details about how to edit a custom report, see Manage custom reports.
Example: Use custom reports to diagnose deployment issues
Attach the StatisticsCollector policy to your API proxies to collect custom analytics data, such as user or product ID, price, REST action, target version, target URL, and message length. The data can come from flow variables predefined by Apigee, request headers, query params, or custom variables that you define.
For example, requests to your API proxy include headers for the product ID, user ID, and target server version. This request could be in the form:
curl -H "prodid:123456" -H "userid:98765" -H "targetversion:beta" http://myapi.com/myapi
You can then use the information in the headers to help diagnose runtime issues with your API proxy.
To create a custom report for these headers:
Add the StatisticsCollector policy to your API to capture the value of the custom headers:
<StatisticsCollector name="publishPurchaseDetails">
  <Statistics>
    <Statistic name="prodid" ref="request.header.prodid" type="integer">0</Statistic>
    <Statistic name="userid" ref="request.header.userid" type="integer">0</Statistic>
    <Statistic name="targetversion" ref="request.header.targetversion" type="string">alpha</Statistic>
  </Statistics>
</StatisticsCollector>
Deploy your proxy and allow time for it to be accessed.
Click Analyze > API Monitoring > Recent in the Edge UI to view any issues with your API. Notice that you are getting 4xx and 5xx errors for the myapi proxy:
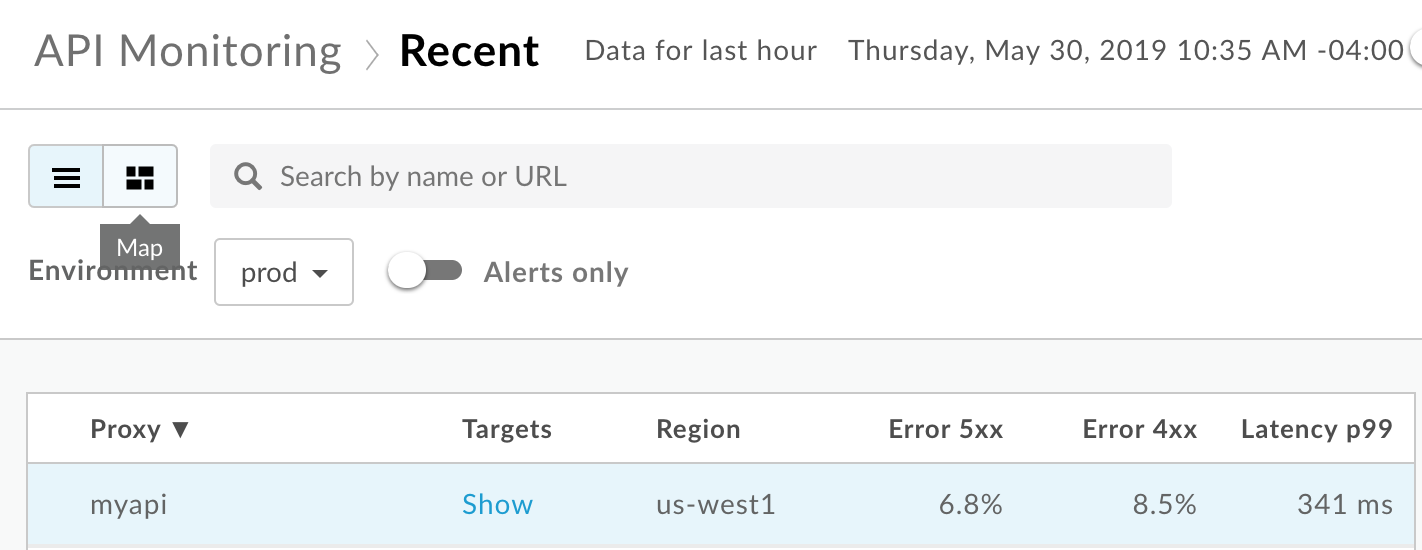
Select the myapi proxy row to view more details in the right pane of the Recent dashboard.
In the right pane of the Recent dashboard, select
 > View in Investigate to access the Investigate dashboard:
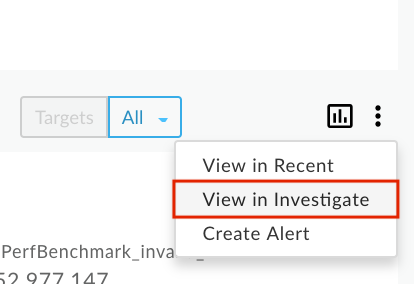
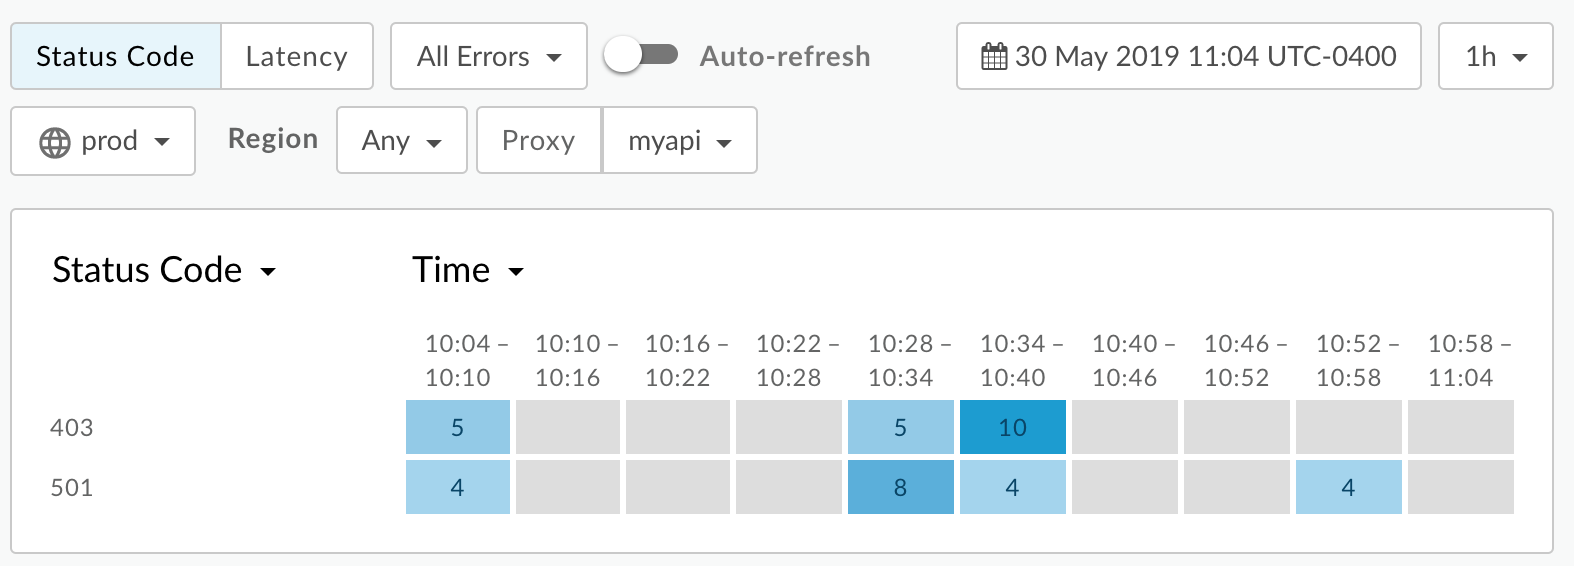
Filter the Investigate dashboard by the myapi proxy and then view the Status Code in the top chart. Notice that you are getting 403 and 501 errors:
In the Edge UI, select Analytics > Custom Reports > Reports to create a custom report that includes the values of these custom metrics as a Dimension.
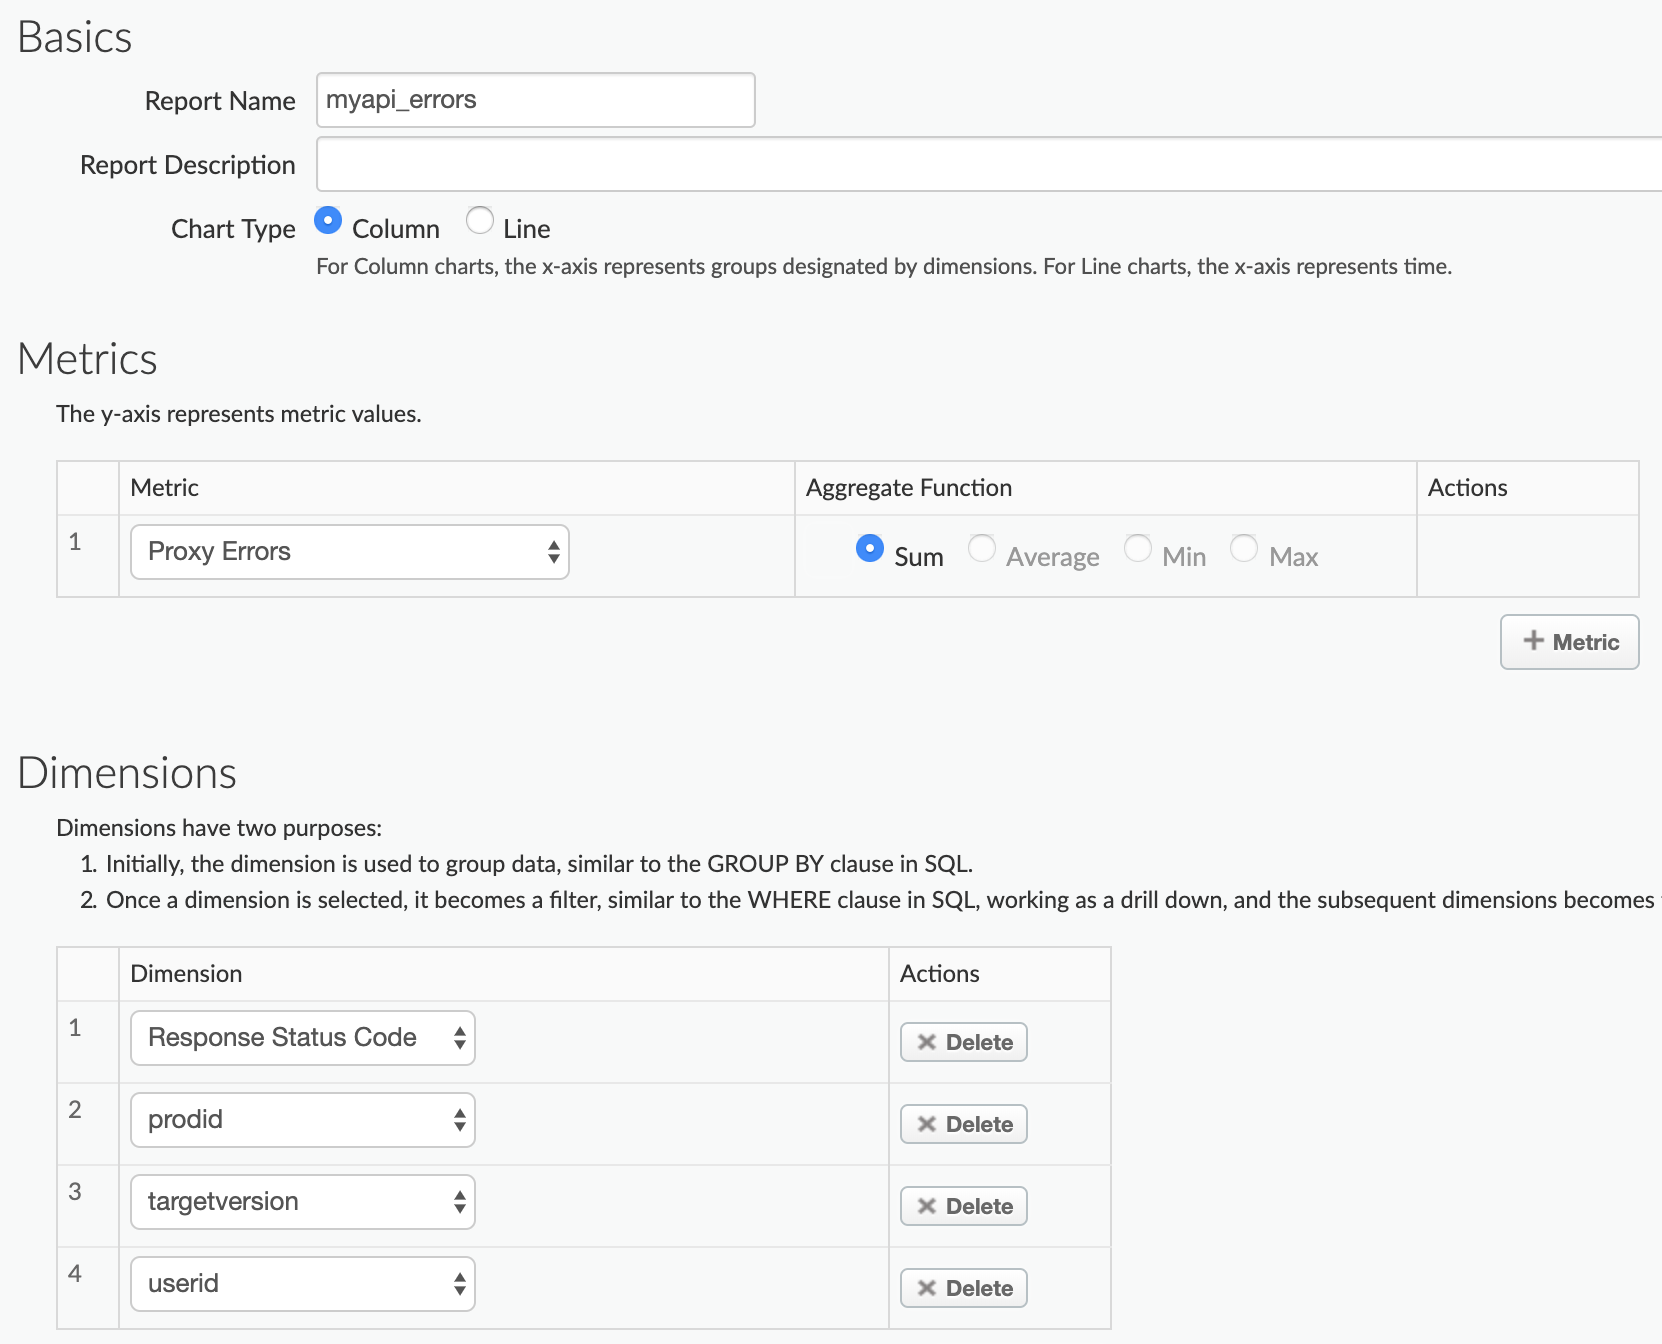
Select + Custom Report to create a custom report named myapi_errors.
Select Proxy Errors for the Metric, and set the Aggregate Function to the Sum. You can add more metrics if you desire.
Select the predefined Response Status Code Dimension, and then add the three custom statistics prodid, targetersion, and userid to Dimensions:
Set the Filter to include only data for the myapi API proxy
(apiproxy eq 'myapi'):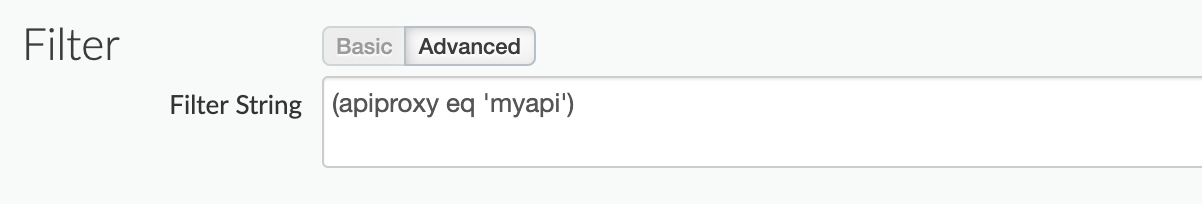
Save the report.
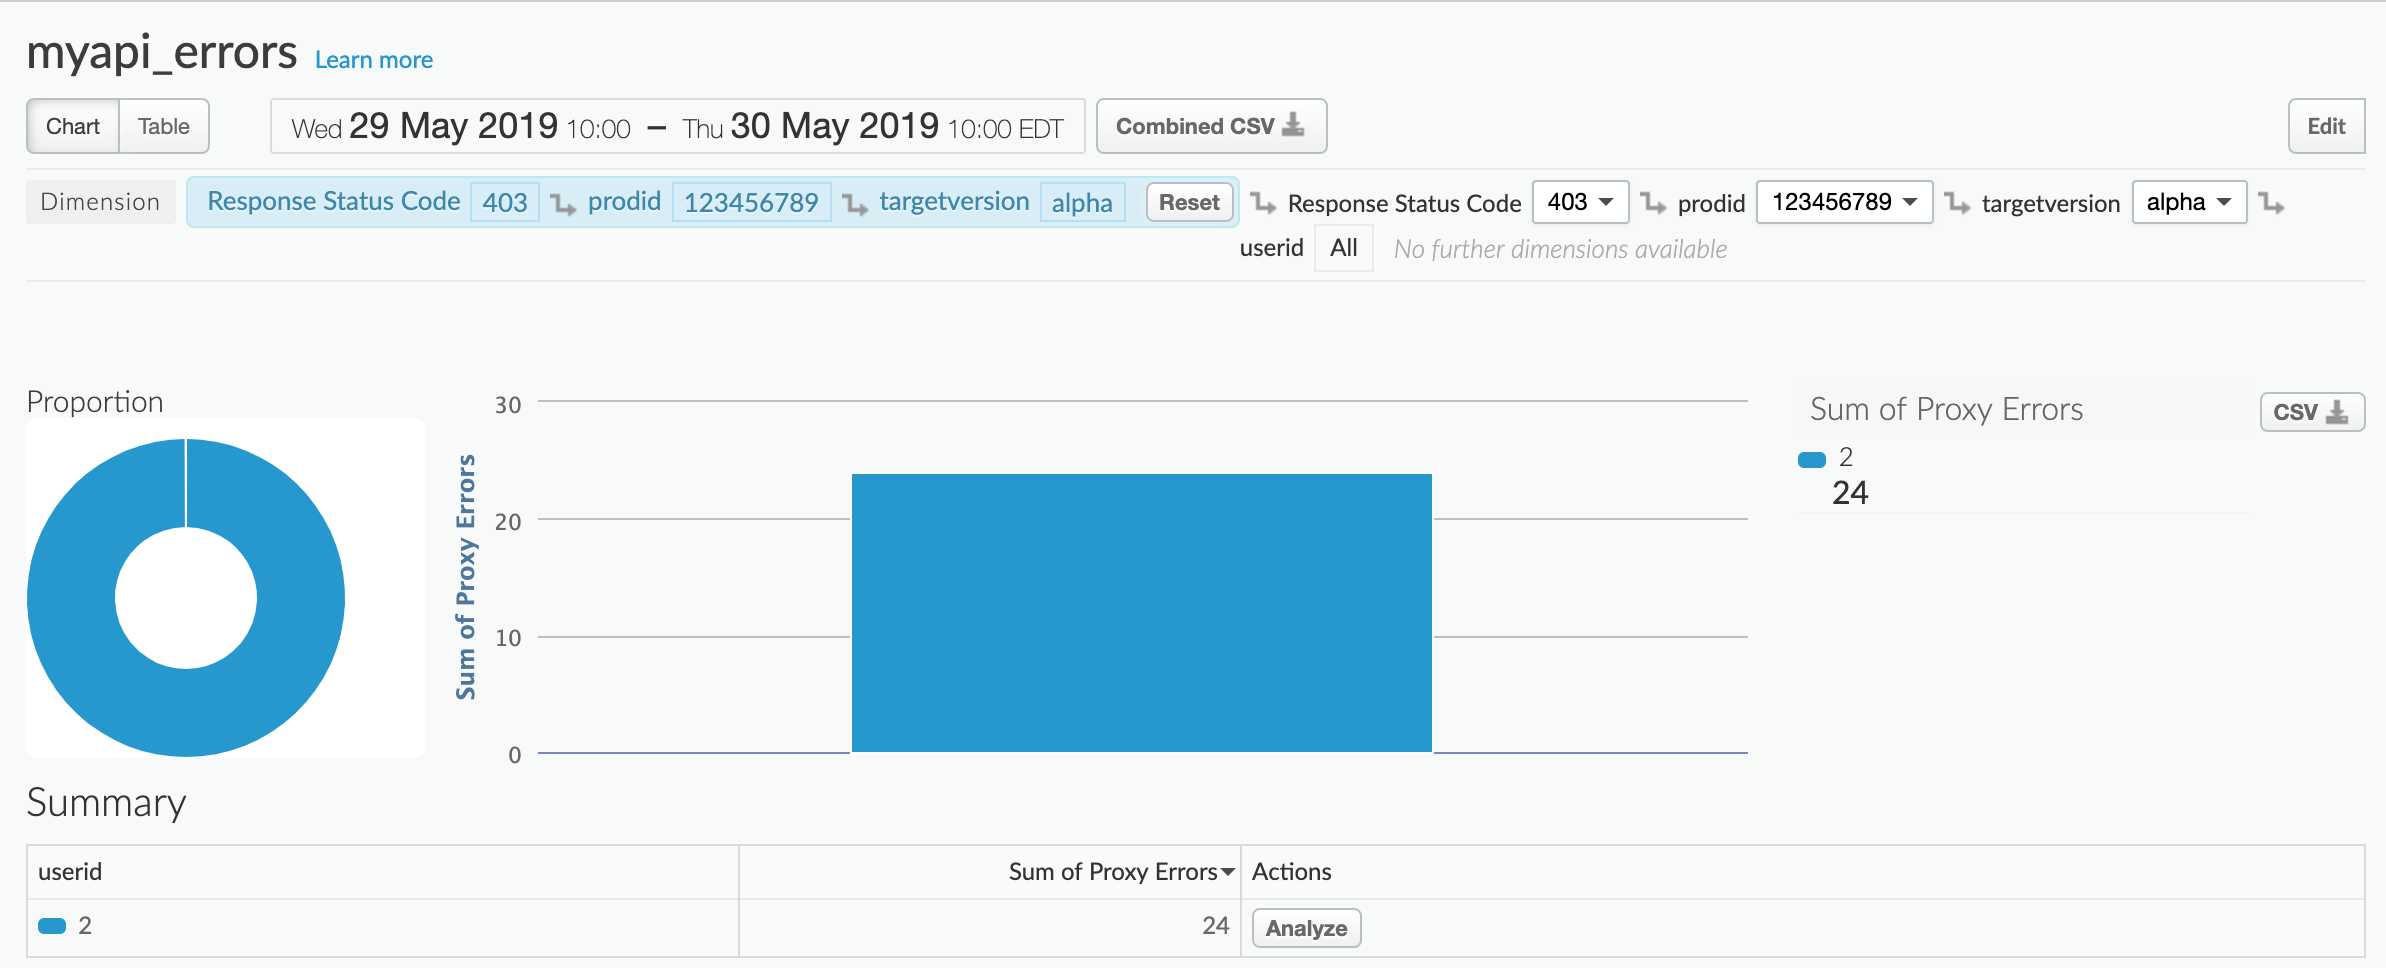
Run the report for the previous 24 hours. When the report first opens, you see a chart of HTTP 403 and 501 errors:
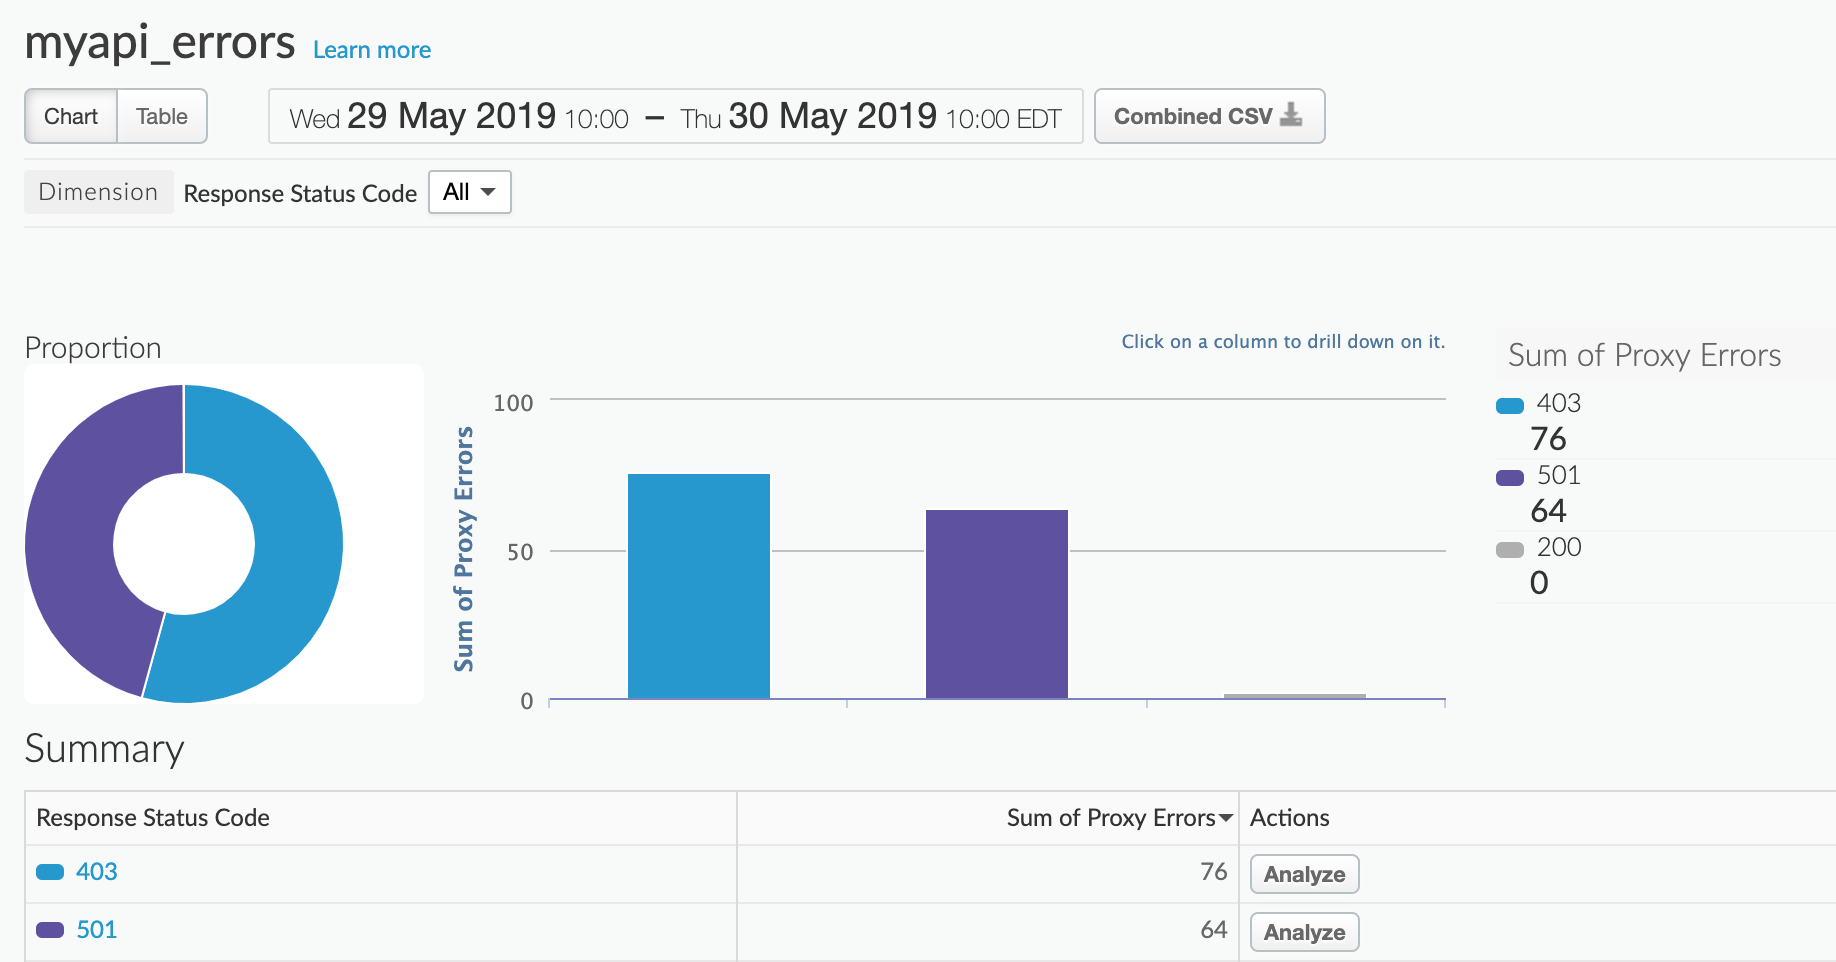
Under Summary, click either 403 or 510 to see which product is generating the errors. For example, you select 403:
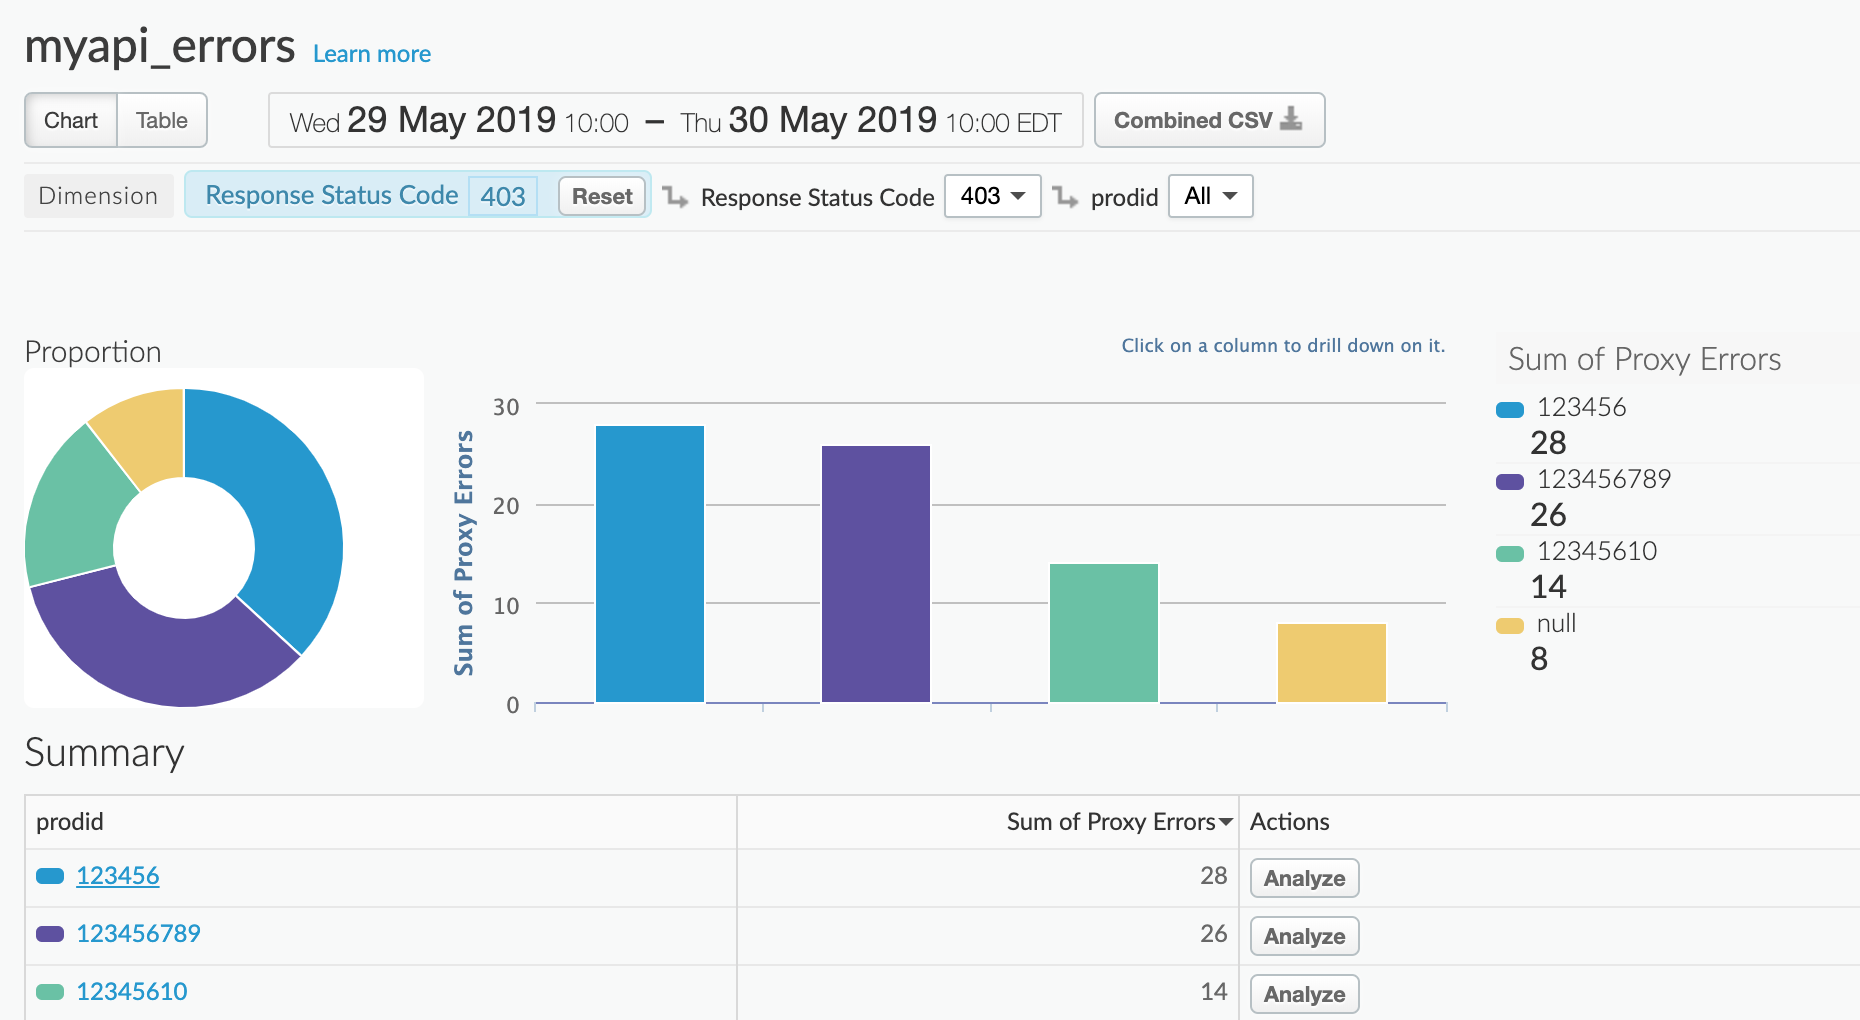
Click a product id under Summary to see the errors by target version (alpha or beta):
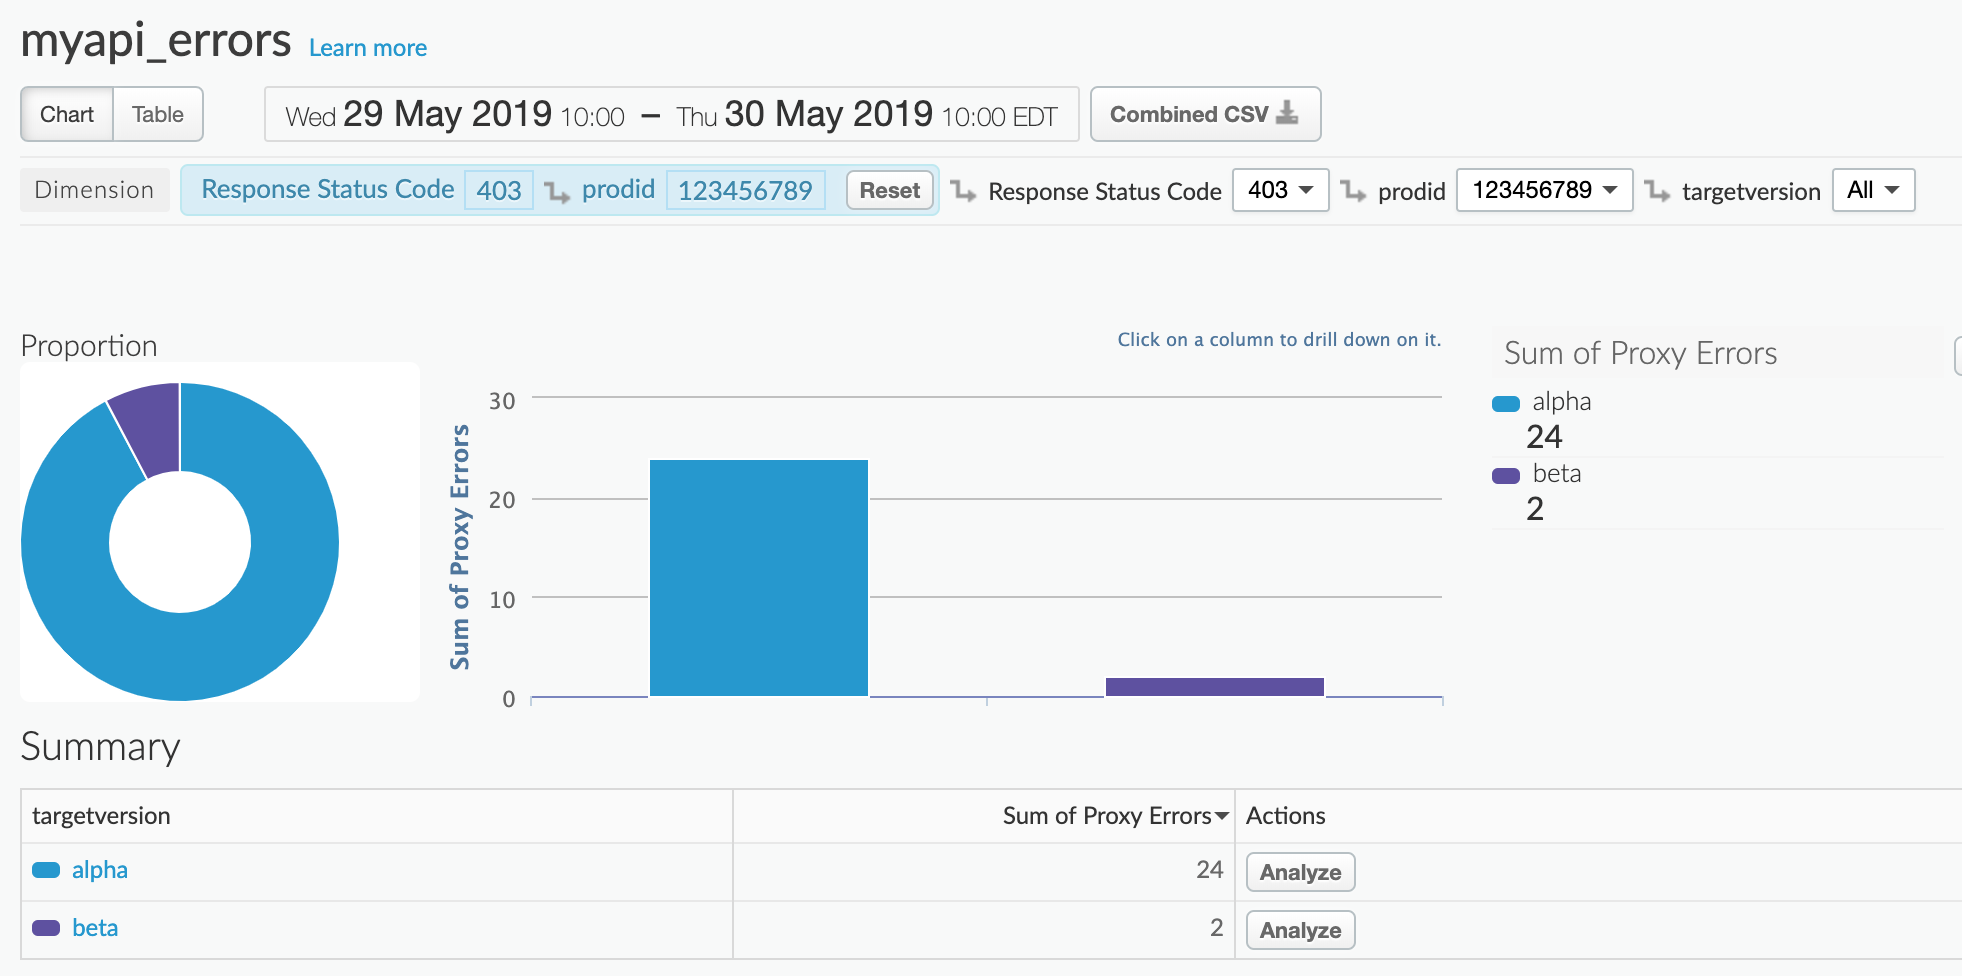
Click a target version under Summary to see the errors by user: