
You're viewing Apigee Edge documentation.
Go to the
Apigee X documentation. info
What does this dashboard tell me?
The Cache Performance dashboard lets you see at a glance the value of your Apigee Edge cache. The dashboard helps you visualize the benefit of the cache in terms of lower latency and reduced load backend servers.
For information about cache management, see Creating and editing an environment cache.
Video: Watch a short video for an overview of the Cache Performance dashboard.
The Cache Performance dashboard
Access the Cache Performance dashboard, as described below.
Edge
To access the Cache Performance dashboard using the Edge UI:
- Sign in to https://apigee.com/edge.
- Select Analyze > API Metrics > Cache Performance.
Classic Edge (Private Cloud)
To access the Cache Performance dashboard using the Classic Edge UI:
- Sign in to
http://ms-ip:9000, where ms-ip is the IP address or DNS name of the Management Server node. - Select Analytics > Cache Performance.
The dashboard opens as shown below:
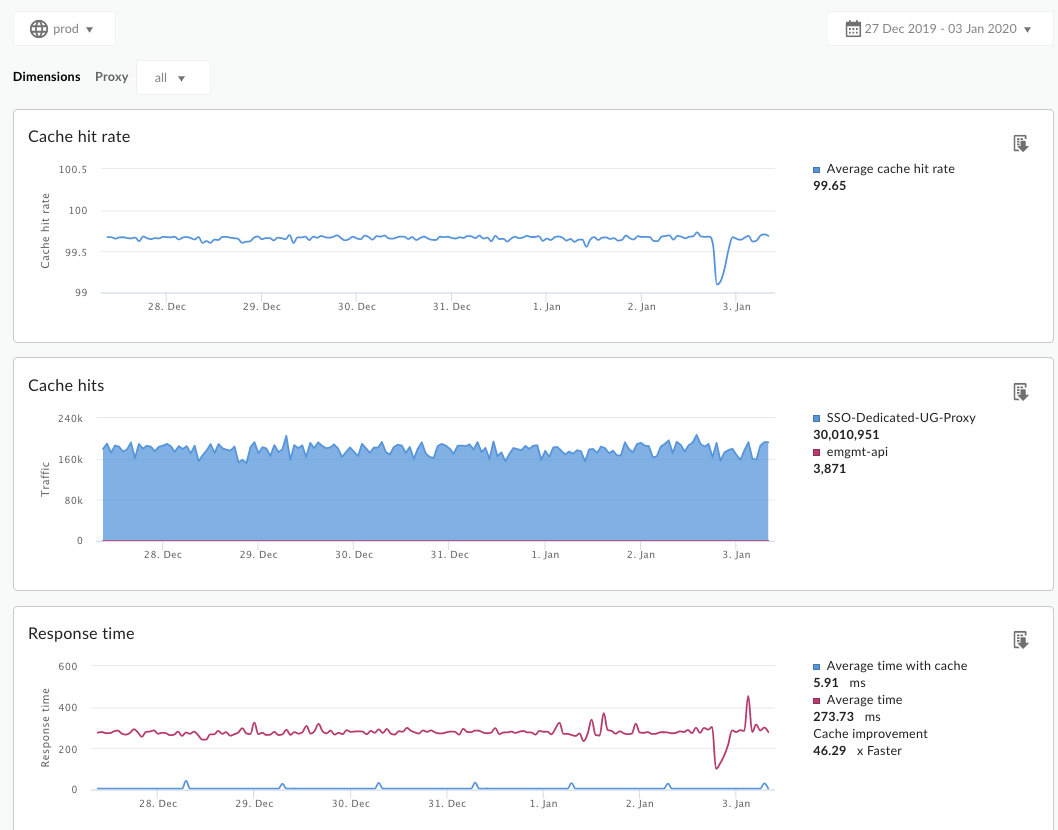
What does this dashboard measure?
| Metric | Description |
|---|---|
| Average cache hit rate | The rate of calls hitting the cache measured against total API traffic. |
| All cache hits | The sum of calls that hit the cache. |
| Cache hits by app | Sum of calls hitting the cache broken down by developer app. |
| Average time with cache | The average amount of time for an API call when it hits the cache. |
| Average time without cache | The average amount of time for an API call when it does not hit the cache. |
| Cache improvement | Compares the average time with cache and average time without cache, giving you an idea of the overall effect of the cache on API performance. |
What else do I need to know about this dashboard?
You can measure cache performance for all API proxies in your organization, or you can select individual ones.
This dashboard uses standard controls, like the date and data aggregation selectors, hovering over graphs for more context, exporting data to CSV, and so on. To learn more, see Using the analytics dashboards.