
You're viewing Apigee Edge documentation.
Go to the
Apigee X documentation. info
What does this dashboard tell me?
The Devices dashboard tells you about the devices and servers that are being used to access your APIs. It lets you spot trends in how users are accessing your APIs. For instance, you might notice that traffic from one type of device is increasing, while another is going down, and then decide if the change requires any action or not.
The Devices dashboard
Access the Devices dashboard, as described below.
Edge
To access the Devices dashboard using the Edge UI:
- Sign in to https://apigee.com/edge.
- Select Analyze > End Users > Devices.
Classic Edge (Private Cloud)
To access the Devices dashboard using the Classic Edge UI:
- Sign in to
http://ms-ip:9000, where ms-ip is the IP address or DNS name of the Management Server node. - Select Analytics > Devices.
The dashboard opens as shown below:
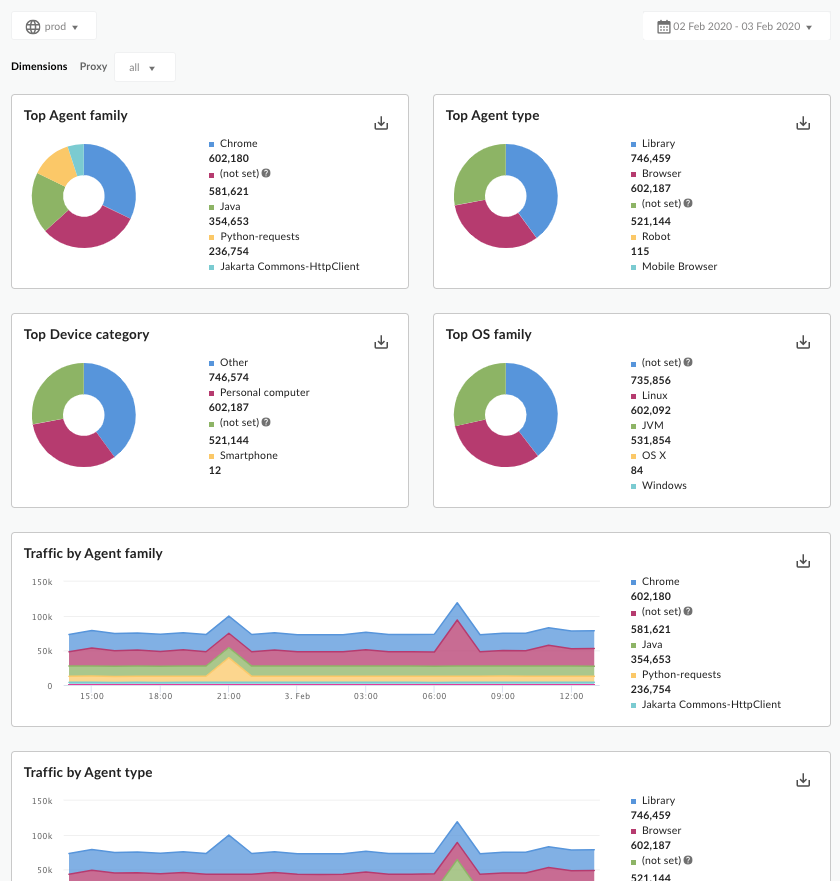
What does this dashboard measure?
In addition to the following metrics, the dashboard shows the top agents, agent types, device types, and OS families.
| Metric | Description |
|---|---|
| Traffic By Agent | Measures how much traffic is coming from a specific application, like Google Chrome, Safari, Firefox, cURL, IE, and other agents. |
| Traffic By Agent type | Tells you if traffic is coming from a browser, a robot, a library, or other agents. |
| Traffic By Device type | Tells you if traffic is coming from a PC, a mobile device, and other categories. |
| Traffic By OS family | Tells you which operating system traffic is coming from. |
What else do I need to know about this dashboard?
You can view data for all API proxies in your organization, or you can use the Proxy drop-down to select individual APIs to analyze. When traffic origination cannot be determined, it is recorded as "Others".
This dashboard uses standard controls, like the date and data aggregation selectors, hovering over graphs for more context, exporting data to CSV, and so on. To learn more, see Using the analytics dashboards.