
You're viewing Apigee Edge documentation.
Go to the
Apigee X documentation. info
Alert conditions define specific status code (for example 404/502/2xx/4xx/5xx), latency, and fault code thresholds that when exceeded trigger visual alerts in the UI and send notifications through a variety of channels, such as email, slack, pagerduty, or webhooks. You can set up alerts at the environment, API proxy or target service, or region level. When an alert is triggered, you will receive a notification using the method you defined when adding alerts and notifications.
For example, you may want to trigger an alert and send a notification to the Operations team when the 5xx error rate exceeds 23% for a period of 5 minutes for the orders-prod API proxy deployed to your production environment.
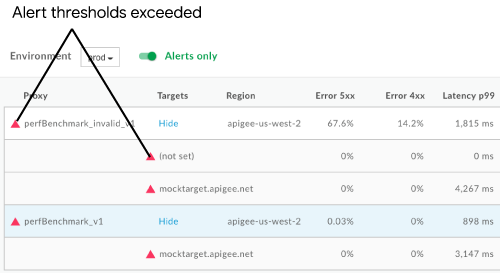
The following figure shows how alerts display in the UI:
The following provides an example of an email notification that you may receive when an alert is triggered.
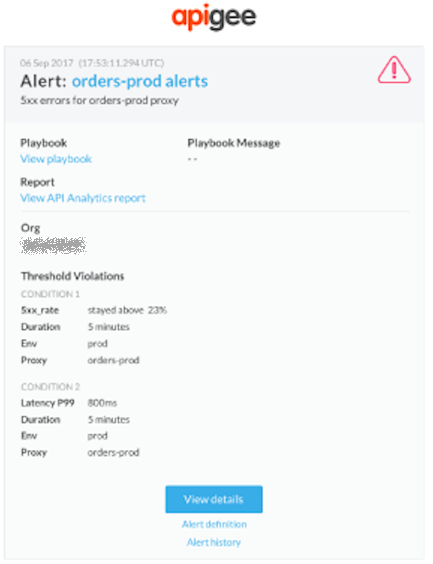
Within the body of the alert notification, click the following links for more information:
- View details to view more details, including the alert settings and activity for each condition over the last hour.
- Alert definition to view the definition of the alert.
- Alert history to view more information about the particular alert.
- View playbook to view the recommended actions, if provided.
- View API Analytics Report to view a custom report for the alert condition.
The following sections describe how to set up and manage alerts and notifications.
About alert types
The initial release of API Monitoring let you create pattern-based rules which specify when to raise an alert based on a set of predefined conditions. These types of alerts are called fixed alerts and were the only type of alerts supported in the initial release of API Monitoring.
For example, you can raise a fixed alert when the:
- [rate of 5xx errors] [is greater than] [10%] for [10 minutes] from [target mytarget1]
- [count of 2xx errors] [is less than] [50] for [5 minutes] in [region us-east-1]
- [p90 latency] [is greater than] [750ms] for [10 minutes] on [proxy myproxy1]
The 19.11.13 Security Reporting Beta release adds new types of alerts:
- Total traffic (Beta) alerts. An alert type that lets you raise an alert when traffic changes by a specified percentage over a time range.
- Anomaly (Beta) alerts. An alert type where Edge detects traffic and performance issues instead of you having to predetermine them yourself. You can then raise an alert for these anomalies.
- TLS Expiry (Beta) alerts. An alert type that lets you raise a notifications when a TLS cert is close to expiring.
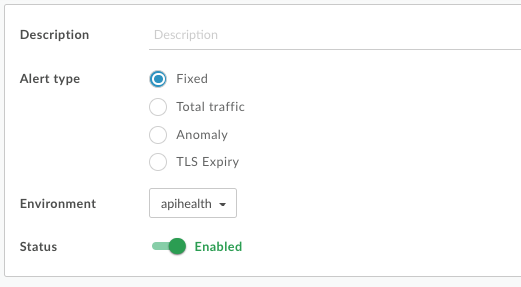
Because API Monitoring now supports multiple types of alerts, the Create Alert dialog box now shows the option for selecting the alert type:
View alert settings
To view alert settings that are currently defined, click Analyze > Alert Rules in the Edge UI.
The Alert page displays, as shown in the following figure:
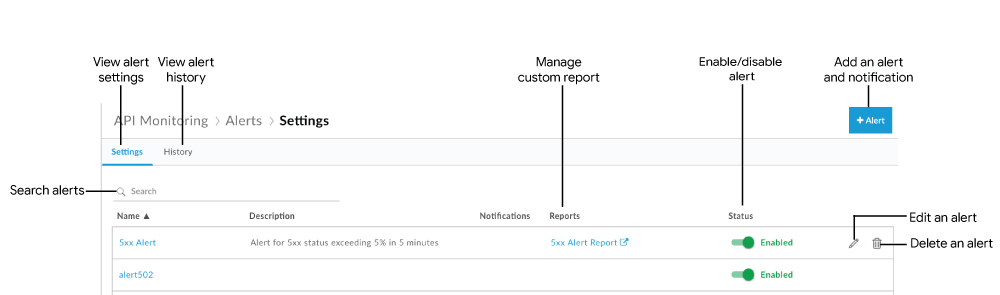
As highlighted in the figure, the Alert page enables you to:
- View a summary of the alert settings that are currently defined
- View the history of alerts that have been triggered
- Add alerts and notifications
- Create a custom report from an alert
- Enable or disable an alert
- Edit an alert
- Delete an alert
- Search the list of alerts for a particular string
View the history of alerts that have been triggered for your organization
To view the history of alerts that have been triggered for your organization for the past 24 hours, click Analyze > Alert Rules in the Edge UI and click the History tab.
The Alert History page is displayed.
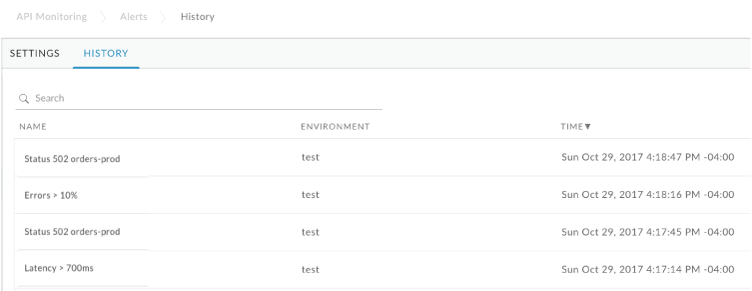
Click the name of the alert to view the details of the alert in the Investigate dashboard. You can filter the list by searching on all or part of the alert name.
Add alerts and notifications
To add alerts and notifications:
- Click Analyze > Alert Rules in the Edge UI.
- Click +Alert.
- Enter the following general information about the alert:
Field Description Alert Name Name of the alert. Use a name that describes the trigger and that will be meaningful to you. The name cannot exceed 128 characters. Alert Type Select Fixed. For more on alert types, see About alert types. Description Description of the alert. Environment Select the environment from the dropdown list. Status Toggle to enable or disable the alert. - Define the metric, threshold, and dimension for the first condition that will trigger the alert.
Condition Field Description Metric Select one of the following metrics:
Status Code: Select a status code from the list, such as 401, 404, 2xx, 4xx, or 5xx HTTP.
Note:
- The API lets you set a wider range of status codes. Use the API to specify any status code between 200-299, 400-599, and the wildcard values of 2xx, 4xx, or 5xx. See Create Alert.
- For rate limiting alerts (HTTP status code 429), set the metric to a Spike Arrest fault code.
- You can use the AssignMessage policy to rewrite the HTTP response code, either from a proxy error or a target error. API Monitoring ignores any rewritten codes and logs the actual HTTP response codes.
- Latency: Select a latency value from the dropdown list. Specifically: p50 (50th percentile), p90 (90th percentile), p95 (95th percentile), or p99 (99h percentile). For example, select p95 to set up an alert that is triggered when the response latency for the 95th percentile is greater than the threshold you set below.
Fault Code: Select a category, subcategory, and fault code from the list. Or select one of the following within a category or subcategory:
- All - Combined total across all fault codes in this category/subcategory must meet the metric criteria.
- Any - Single fault code in this category/subcategory must meet the metric criteria.
See Fault code reference for more information.
- Total traffic (Beta): Select traffic increase or decrease. See Traffic (Beta) alerts for more.
Threshold Configure threshold for the selected metric:
- Status Code: Set the threshold as a percentage rate, count, or transactions per second (TPS) over time.
- Latency: Select the threshold as a total or target latency duration (ms) over time. In this case, an alert is fired if the specified percentile observed latency, which is updated each minute if traffic is present, exceeds the threshold condition for the timespan covering the specified time duration. That is, the threshold condition is not aggregated over the full time duration.
- Fault Code: Set the threshold as a percentage rate, count, or transactions per second (TPS) over time.
Dimension Click +Add Dimension and specify the dimension details for which to return results including the API proxy, target service, or developer app, and region. If you set a specific dimension to:
- All - All entities in the dimension must meet the metric criteria. You cannot select All for a metric of type Latency.
- Any - Applicable to region only. An entity in the dimension must meet the metric criteria for any single region.
Note: For API proxies or target services, select a Collection to support Any functionality. - Collections - Select a collection from the list to specify the set of API proxies or target services. In this case, any entity in the collection must meet the criteria.
If you set dimension to Target, you can select a target service or the service specified by a ServiceCallout policy. The target of a ServiceCallout policy is displayed as a value prefixed by `sc://`. For example, `sc://my.endpoint.net`.
- Click Show condition data to show recent data for the condition over the last hour.
The error rate in the graph displays red when it exceeds the alert condition threshold.
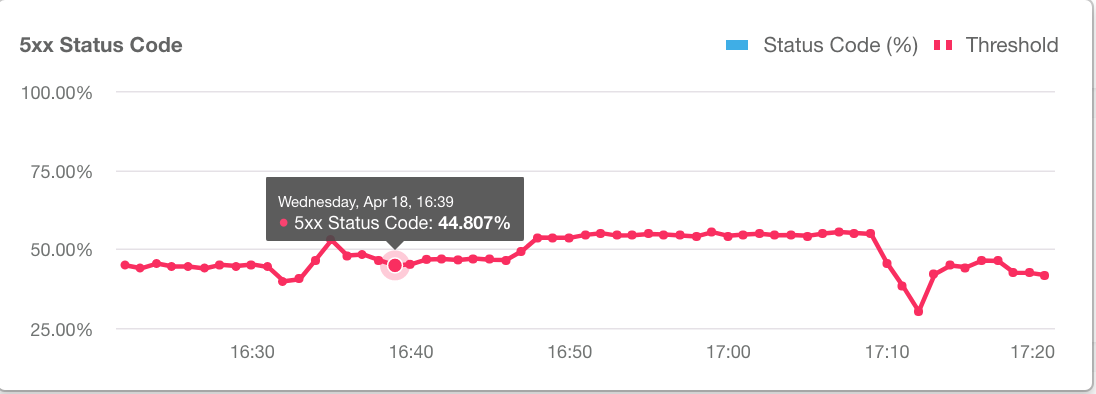
Click Hide condition data to hide the data.
- Click + Add Condition to add additional conditions and repeat steps 4 and 5.
Note: If you specify multiple conditions, the alert will be triggered when all the conditions are met.
Click Create an API analytics reports based on alert conditions if you want to create a custom report based on the alert conditions that you configured. This option is greyed out if you are not an organization administrator.
For more information, see Create a custom report from an alert.
Note: You can modify the custom report after you save the alert, as described in Managing custom reports.
- Click + Notification to add an alert notification.
Notification Details Description Channel Select the notification channel that you want to use and specify the destination: Email, Slack, PagerDuty, or Webhook. Destination Specify the destination based on the selected channel type: - Email - Email address, such as
joe@company.com - Slack - Slack channel URL, such as
https://hooks.slack.com/services/T00000000/B00000000/XXXXX - PagerDuty - PagerDuty code, such as
abcd1234efgh56789 Webhook - Webhook URL, such as
https://apigee.com/test-webhook. See Webhook object format for a description of the object sent to the URL.Pass any credential information in the URL of the webhook. For example:
https://apigee.com/test-webhook?auth_token=1234_abcd.You can specify the URL to an endpoint that can parse the webhook object to modify or process it. For example, you can specify the URL to an API, such as an Edge API, or to any other endpoint that can process the object.
Note: You can specify only one destination per notification. To specify multiple destinations for the same channel type, add additional notifications.
- Email - Email address, such as
- To add additional notifications, repeat step 8.
- If you added a notification, set the following fields:
Field Description Playbook (Optional) Free-form text field to provide a short description of recommend actions for resolving the alerts when they fire. You can also specify a link to your internal wiki or community page where you reference best practices. The information in this field will be included in the notification. The contents in this field cannot exceed 1500 characters. Throttle Frequency with which to send notifications. Select a value from the dropdown list. Valid values include: 15 minutes, 30 minutes, and 1 hour. - Click Save.
Webhook object format
If you specify a Webhook URL as the destination of an alert notification, then the object sent to the URL has the following format:{ "alertInstanceId": "event-id", "alertName": "name", "org": "org-name", "description": "alert-description", "alertId": "alert-id", "alertTime": "alert-timestamp", "thresholdViolations":{"Count0": "Duration=threshold-duration Region=region Status Code=2xx Proxy=proxy Violation=violation-description" }, "thresholdViolationsFormatted": [ { "metric": "count", "duration": "threshold-duration", "proxy": "proxy", "region": "region", "statusCode": "2xx", "violation": "violation-description" } ], "playbook": "playbook-link" }
The thresholdViolations and thresholdViolationsFormatted properties
contain details about the alert. The thresholdViolations property contains a single string
with the details, while thresholdViolationsFormatted contains an object describing the alert.
Typically you use the thresholdViolationsFormatted property because it is simpler to decode.
The example above shows the contents of these properties
for a fixed alert when you configure the alert metric to trigger
based on the HTTP 2xx status code, as indicated by the statusCode property.
The contents of these properties depend on the
type of alert, such as fixed or anomaly, and the specific configuration of the alert.
For example, if you create a fixed alert based on a fault code,
then the thresholdViolationsFormatted property contains a faultCode property
instead of a statusCode property.
The following table shows all the possible properties of the thresholdViolationsFormatted
property for different alert types:
| Alert type | Possible thresholdViolationsFormatted contents |
|---|---|
| Fixed | metric, proxy, target, developerApp, region, statusCode, faultCodeCategory, faultCodeSubCategory, faultCode, percentile, comparisonType, thresholdValue, triggerValue, duration, violation |
| Total trafic | metric, proxy, target, developerApp, region, comparisonType, thresholdValue, triggerValue, duration, violation |
| Anomaly | metric, proxy, target, region, statusCode, faultCode, percentile, sensitivity, violation |
| TLS expiry | envName, certificateName, thresholdValue, violation |
Create a custom report from an alert
To create a custom report from an alert:
- When creating an alert, click Create an API analytics reports based on alert conditions, as described in Adding alerts and notifications.
After you save the alert, the UI displays the following message:
Alert alertName saved successfully. To customize the report generated, click here.
Click the message to open the report in a new tab with relevant fields pre-populated. By default, the custom report is named:
API Monitoring Generated alertName - Edit the custom report, as desired, and click Save.
- Click the name of the report on the list and run the custom report.
To manage the custom report created based on alert conditions:
- Click Analyze > Alert Rules in the Edge UI.
- Click the Settings tab.
- In the Reports column, click the custom report associated with the alert that you want to manage.
The custom report page displays in a new tab. If the Reports column is blank, a custom report has not yet been created. You can edit the alert to add a custom report, if desired.
- Edit the custom report, as desired, and click Save.
- Click the name of the report on the list and run the custom report.
Enable or disable an alert
To enable or disable an alert:
- Click Analyze > Alert Rules in the Edge UI.
- Click the toggle in the Status column associated with the alert that you want to enable or disable.
Edit an alert
To edit an alert:
- Click Analyze > Alert Rules in the Edge UI.
- Click the name of the alert you want to edit.
- Edit the alert, as required.
- Click Save.
Delete an alert
To delete an alert:
- Click Analyze > Alert Rules in the Edge UI.
- Position the cursor over the alert you want to delete and click
 in the actions menu.
Suggested alerts
Apigee suggests that you set up the following alerts to be notified about common issues. Some of these alerts are specific to the implementation of your APIs and are only useful in certain situations. For example, several alerts shown below are only applicable if you are using the ServiceCallout policy or the JavaCallout policy.
| Alert | UI Example | API Example |
|---|---|---|
| 5xx status codes for all/any APIs | Set up a 5xx status code alert for an API proxy | Set up a 5xx status code alert for an API proxy using the API |
| P95 latency for an API proxy | Set up a P95 latency alert for an API proxy | Set up a P95 latency alert for an API proxy using the API |
| 404 (Application Not Found) status codes for all API proxies | Set up a 404 (Application Not Found) status code alert for all API proxies | Set up a 404 (Application Not Found) status code alert for all API proxies using the API |
| API proxy count for APIs | Set up an API proxy count alert for APIs | Set up an API proxy count alert for APIs using the API |
| Error rates for target services | Set up an error rate alert for target services | Set up an error rate alert for target services using the API |
| Error rates for ServiceCallout policies (if applicable) | Set up an error rate alert for the ServiceCallout policy | Set up an error rate alert for the ServiceCallout policy using the API |
Specific fault codes, including:
|
Set up a policy fault code alert | Set up a policy fault code alert using the API |
Set up a 5xx status code alert for an API proxy
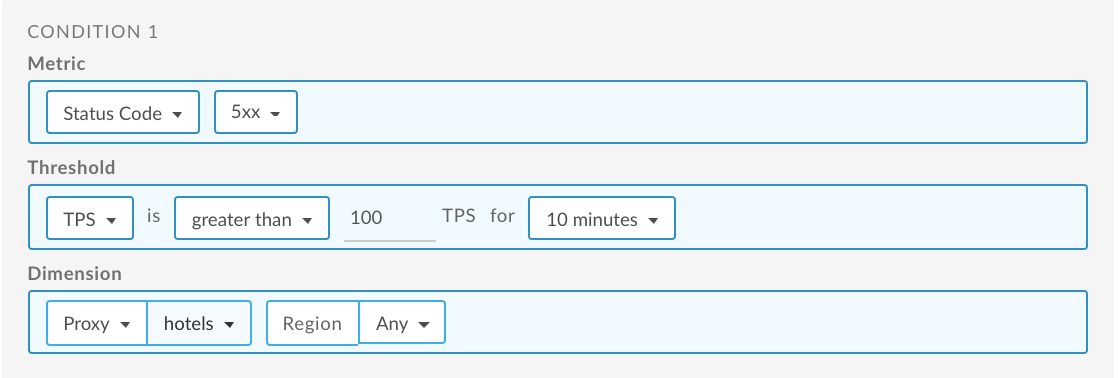
The following provides an example of how to set up an alert using the UI that is triggered when the transactions per second (TPS) of 5xx status codes for the hotels API proxy exceeds 100 for 10 minutes for any region. For more information, see Add alerts and notifications.
For information about using the API, see Set up a 5xx status code alert for a proxy using the API.
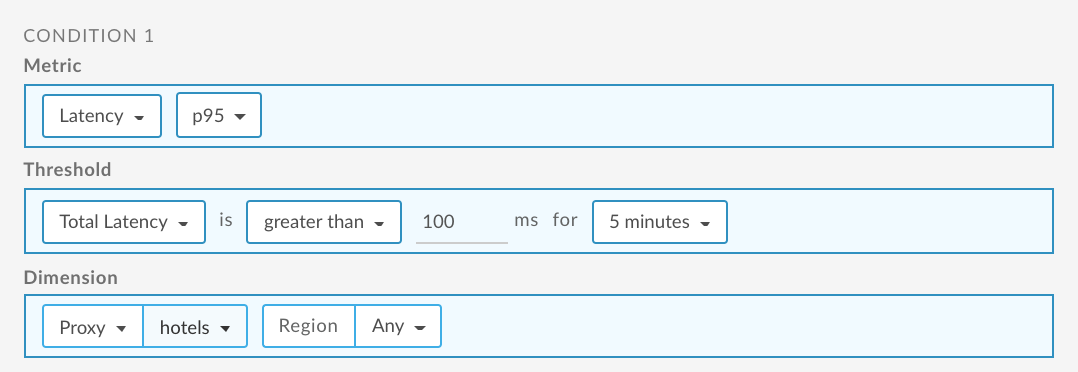
Set up a P95 latency alert for an API proxy
The following provides an example of how to set up an alert using the UI that is triggered when total response latency for the 95th percentile is greater than 100 ms for 5 minutes for the hotels API proxy for any region. For more information, see Add alerts and notifications.
For information about using the API, see Set up a P95 latency alert for an API proxy using the API
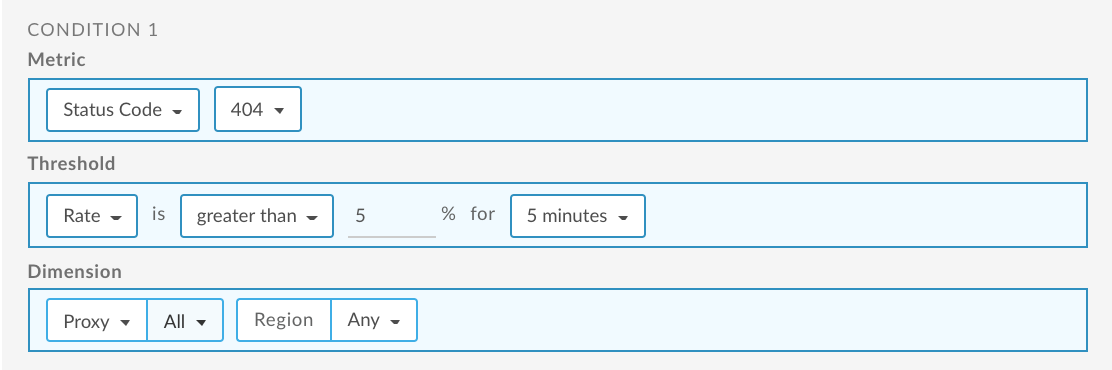
Set up a 404 (Application Not Found) alert for all API proxies
The following provides an example of how to set up an alert using the UI that is triggered when the percentage of 404 status codes for all API proxies exceeds 5% for 5 minutes for any region. For more information, see Add alerts and notifications.
For information about using the API, see Set up a 404 (Application Not Found) alert for all API proxies using the API.
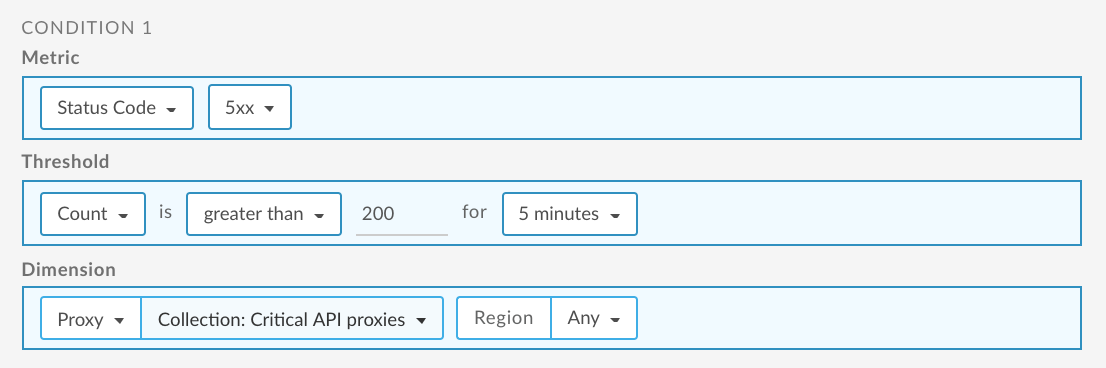
Set up an API proxy count alert for APIs
The following provides an example of how to set up an alert using the UI that is triggered when the 5xx code count for APIs exceeds 200 for 5 minutes for any region. In this example, the APIs are captured in the Critical API Proxies collection. For more information, see:
For information about using the API, see Set up an API proxy count alert for APIs using the API.
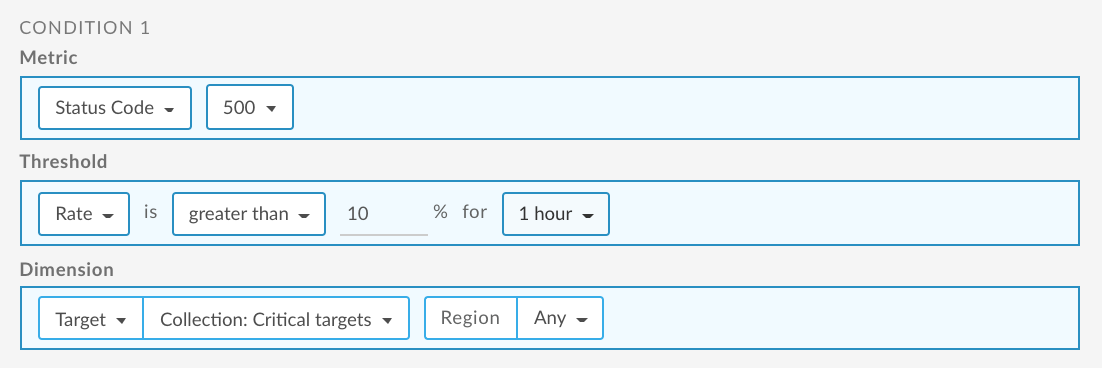
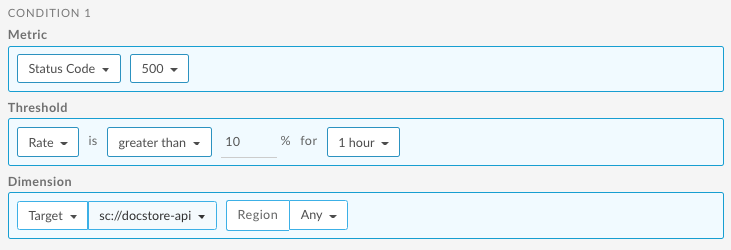
Set up an error rate alert for target services
The following provides an example of how to set up an alert using the UI that is triggered when the 500 code rate for target services exceeds 10% for 1 hour for any region. In this example, the target services are captured in the Critical targets collection. For more information, see:
For information about using the API, see Set up an error rate alert for target services using the API.
Set up an error rate alert for ServiceCallout policy
The following provides an example of how to set up an alert using the UI that is triggered when the 500 code rate for the service specified by the ServiceCallout policy exceeds 10% for 1 hour for any region. For more information, see:
For information about using the API, see Set up an error rate alert for the Service Callout policy using the API.
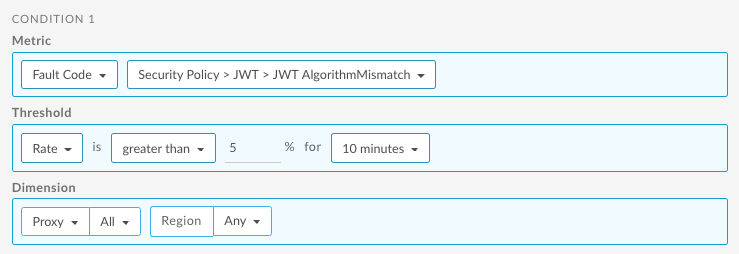
Set up a policy fault code alert
The following provides an example of how to set up an alert using the UI
that is triggered when the JWT AlgorithmMismatch fault code count
for the VerifyJWT policy is greater than 5 for 10 minutes for all APIs.
For more information, see:
For information about using the API, see Set up a fault code alert for policy fault code using the API.