You're viewing Apigee Edge documentation.
Go to the
Apigee X documentation. info
API Monitoring lets you create pattern-based rules that trigger alerts based on a set of predefined conditions. These types of alerts are called fixed alerts and were the only type of alerts supported in the initial release of API Monitoring.
For example, you can raise a fixed alert when the:
- [rate of 5xx errors] [is greater than] [10%] for [10 minutes] from [target mytarget1]
- [count of 2xx errors] [is less than] [50] for [5 minutes] in [region us-east-1]
- [p90 latency] [is greater than] [750ms] for [10 minutes] on [proxy myproxy1]
When the conditions of a fixed alert are met, API Monitoring raises an alert to notify you of the issue. However, you must have defined the specific alert conditions before API Monitoring can raise the alert.
While fixed alerts are valuable, it can be hard to determine the right thresholds for a condition because traffic patterns change over time. For example, if you set a threshold too low, you will be flooded with alerts. If you set a threshold too high, you might miss some critical problems or outages.
Anomaly detection
With anomaly detection, you let Edge detect traffic and performance issues instead of having to predetermine them yourself. Edge automatically looks for anomaly conditions at the organization, environment, and region levels. When detected, the anomaly is logged for display on the Events dashboard in the Edge UI.
Anomaly detections works by applying artificial intelligence (AI) and Machine Learning (ML) models to your historical API data. Anomaly detection can then raise alerts in real time for scenarios that you haven’t even thought of to improve your productivity and reduce the mean mime to mesolution (MTTR) of your API issues.
Examples of detected anomalies can include situations where a new API release leads to an unexpected surge in traffic and a corresponding increase in latency for the API. Or, a misconfigured release on the backend leads to an increase in backend errors reported by the API.
A detected anomaly includes the following information:
- The metric that caused the anomaly, such as proxy latency or an HTTP error code.
- The threshold of the anomaly. The threshold can be slight, moderate, or severe.
For example, Edge can automatically detect an anomaly such as:
- A [slight] [uptick in 503 errors] in [environment prod, region region1]
- A [moderate] [uptick in 4xx errors] in [environment prod, region region2]
- A [severe] [latency increase] in [environment prod, region region3]
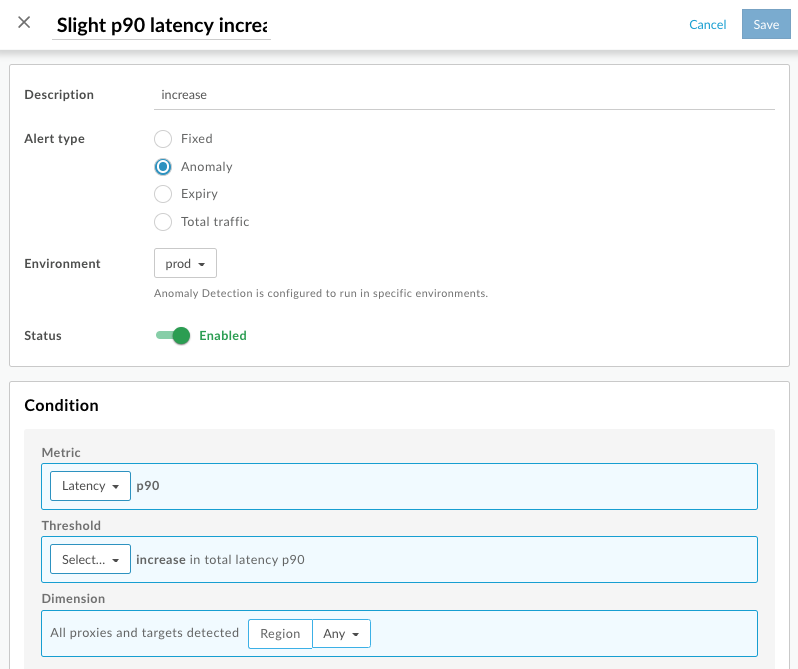
From the anomaly information displayed in the Events dashboard, you can then create a new type of alert, called an anomaly alert, to notify you of these conditions.
Anomaly types
Edge automatically detects the following types of anomalies:
- Increase in HTTP 503 errors at the organization, environment, and region level
- Increase in HTTP 504 errors at the organization, environment, and region level
- Increase in all HTTP 4xx or 5xx errors at the organization, environment, and region level
- Increase in the total response latency for the 90th percentile (p90) at the organization, environment, and region level
Enable anomaly detection
By default, anomaly detection is disabled for Edge organizations and environments. To enable anomaly detection, make a request to Apigee Edge Support to enable it for a specific organization and environment. Apigee will evaluate your environment and let you know if anomaly detection can be enabled.
For performance reasons, do not enable anomaly detection on all organizations and environments. Apigee recommends that you only enable anomaly detection on an organization and environment that has an average traffic load of at least 10 transactions per second (tps).
Check if anomaly detection is enabled
To check if anomaly detection is enabled:
- Select Analyze > Alert Rules in the Edge UI.
Select the + Alert button. The create alert panel opens:

Select the desired Environment.
If the Anomaly option is greyed out for Alert type, then anomaly detection is disabled.
