You're viewing Apigee Edge documentation.
Go to the
Apigee X documentation. info
This topic introduces Edge API Analytics.
Video: Watch a short video for an overview of Edge API Analytics services.
Improve your API through analytics
Edge API Analytics collects and calculates a wealth of information that flows through API proxies. You can visualize this data with graphs and charts in the Edge UI, or you can download the raw data for offline analysis using the Edge management APIs.
Analytics help you answer common questions, such as:
- How is my API traffic trending over time?
- Which API methods are most popular?
- Who are my top developers?
- When is API response time fastest? Slowest?
- Geographically, where do I see the most API traffic?
The answers to questions like these help you improve your APIs, troubleshoot problems, and make better business decisions related to your API program.
API Analytics helps everyone improve
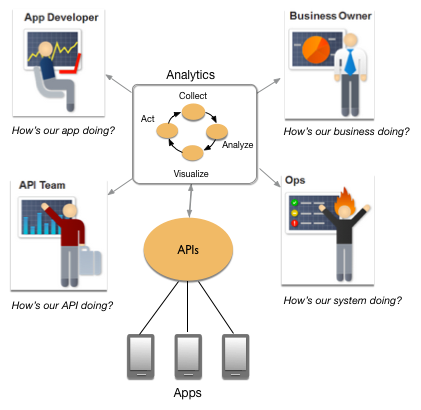
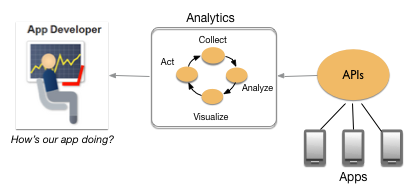
Through a continual process of collecting, analyzing, and visualizing data, Edge API Analytics helps your API team improve their APIs and helps app developers improve their apps:

- API Team - The API team is tapping into internal systems to create interesting APIs. The API team wants to know how the API program is doing overall, how individual APIs are doing, and how to improve their APIs.
- App Developers - By sharing analytics information with app developers, you get better apps. These developers are innovating with your API and building creative apps that help drive revenue to your enterprise. Analytics help app developers know how their apps are doing and how much they are contributing to the bottom line of your enterprise. App developers want to know how they can improve their apps.
- Ops Team - The operations team wants to understand traffic patterns and anticipate when to add backend resources or make other critical adjustments.
- Business Owner - The business owner wants to see how their API investment is paying off and where to invest API dollars in the future.
What kind of data is collected and analyzed?
Edge API Analytics collects and analyzes a broad spectrum of data that flows across API proxies such as:
- Response time
- Request latency
- Request size
- Target errors
- API product name
- Developer email address
- App name
- Many others
For a complete listing of data collected by API Analytics, see Analytics metrics, dimensions, and filters reference.
How do I collect custom analytics data?
Edge natively collects a wealth of data. You might also want to collect custom analytics data specific to your API proxies, apps, products, or developers. For example, you might want to gather analytics data from query parameters, request headers, request and response bodies, or variables that you define in your APIs.
You collect custom analytics data by using the StatisticsCollector policy. Once the custom data is extracted, you can use the analytics UI or API to examine the data. See Analyze API message content using custom analytics for complete example demonstrating how to collect custom analytics data.
Differences between Analytics data and API Monitoring data
This section describes some minor differences between data gathered by Edge Analytics versus API Monitoring. Since API Monitoring and Analytics use different data pipelines, you may see minor differences between custom reports generated by Monitoring and reports generated by Analytics. For example, you might see discrepancies in reported results for timeout errors—both backend timeouts (HTTP status code 504 on the request) and client timeouts (HTTP status code 499). These may appear with status code 200 in Analytics custom reports, but will show up with status code 504 or 499 in Monitoring custom reports.When and for how long is my analytics data available?
There are two time intervals that control when and for how long you can view your analytics data:
- Data delay interval - After a call is made to an API proxy, it can take up to 10 minutes for the data to be accessible for display or through management API calls.
- Data retention -
The length of time Analytics data is retained depends on your subscription plan:
- Standard: 30 days
- Enterprise: 3 months
- Enterprise Plus: 14 months
How do I access my analytics data?
Edge API Analytics provides data visualization tools built into the Edge UI. These tools include predefined analytics dashboards and custom reports that display data in graphs and charts and let you drill down to see data grouped into different dimensions (such as by API proxy, IP address, or HTTP status code).
In addition, you can download analytics data by using the Edge management API. Once downloaded, you can import that data into your own data visualization tools or analytics system.
Analytics dashboards
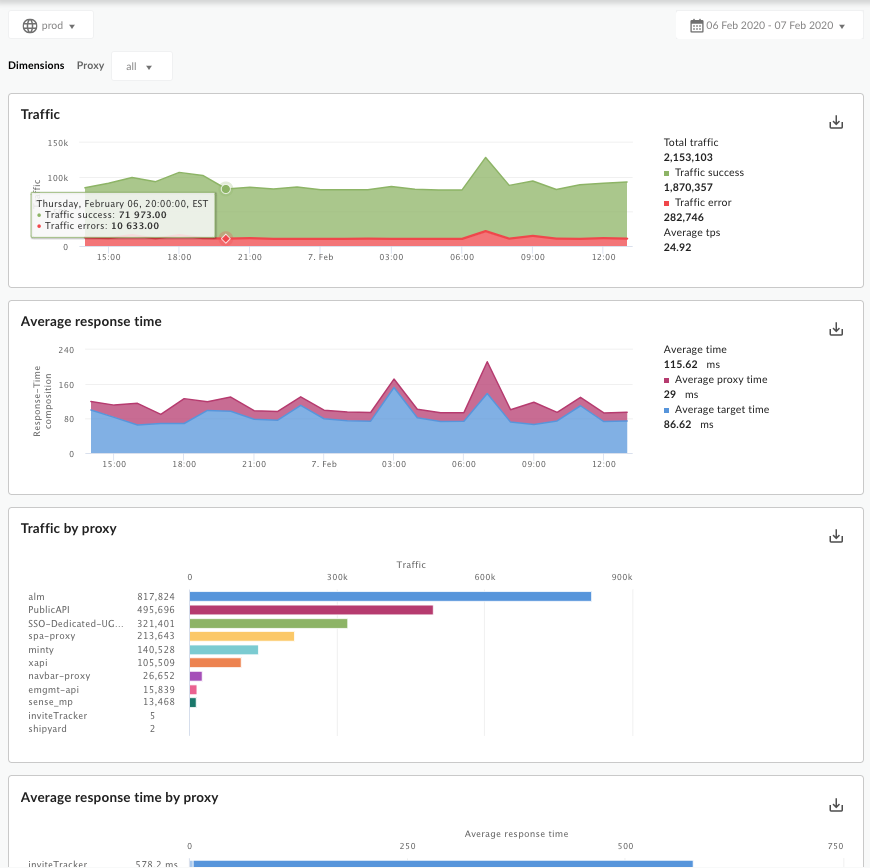
The Edge UI provides a set of predefined dashboards that you can use to view analytics data. For example, the following images shows the Proxy Performance dashboard:

This dashboard includes charts for:
- Total Traffic - The total number of API requests received by Edge for an API environment in an organization.
- Traffic Success - The total number of requests that resulted in a successful response. Error responses do not count.
- Traffic Errors - The total number of all API requests that are unsuccessful; that is, the request does not deliver a response. The count includes both Proxy errors (Apigee side) and Target errors (the backend services).
- Average TPS - The average number of API requests and resulting responses per second.
Additional predefined dashboards include:
- Cache performance
- Developer engagement
- Device usage
- Error code analysis
- GeoMap
- Latency analysis
- Target performance
- Traffic composition
For more information on these predefined dashboards, see Using the analytics dashboards.
Custom reports
Custom reports let you drill-down into specific API metrics and view the exact data that you want to see. You can create a custom report by using any of the analytics data built into Edge or custom analytics data collected by the StatisticsCollector policy.
When building a custom report, you select the data you want to see (metrics), group the data in meaningful ways (dimensions), and optionally limit the data returned based on specific characteristics of the data (filtering).
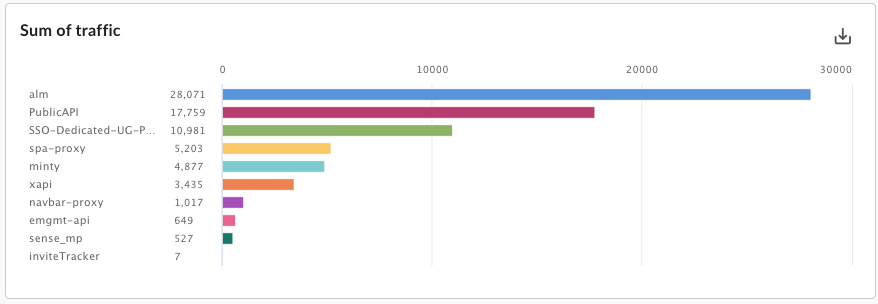
You can also set the chart type displayed in the custom report as a column or line chart. The following images show chart examples for transactions per second grouped by API proxy:
Column - Each API proxy is represented by a different column:

Line - Each API proxy is represented be a different line:

For more, see Create and manage custom reports.
Analytics API
Use the Edge management API to download analytics data. For example, you can use the API to build your own visualization tools that you can embed in portals or custom apps.
Here's an example API call to retrieve analytics data for API proxies:
curl  https://api.enterprise.apigee.com/v1/o/org_name/environments/test/stats/apiproxy?"select=sum(message_count)&timeRange=6/24/2018%2000:00~6/24/2018%2023:59&timeUnit=hour" \
-u email:password
This call returns:
- The sum of requests (message count) per API proxy
- For a 24 hour period
- Grouped by hour
The timeRange query parameter specifies the time period in the form:
?timeRange=MM/DD/YYYY%20HH:MM~MM/DD/YYYY%20HH:MM
Notice the %20 before HH:MM. The timeRange parameter requires
a URL-encoded space character before HH:MM, or a + character, as in:
MM/DD/YYYY+HH:MM~MM/DD/YYYY+HH:MM.
For more, see Use the metrics APIs to measure API program performance.
Export analytics data to Google Cloud
You can use the Edge management API to export all analytics data for an entire day from Edge to your own data repository, such as Google Cloud Storage or BigQuery. You can then take advantage of the powerful query and machine learning capabilities offered by Google Cloud BigQuery and TensorFlow to perform your own data analysis.
For more, see Export data from analytics.
How do I share data with app developers?
When you think of app developers as your customers, you'll want to make sure they have the tools and information available to them to make the best use of your API.

App developers are not only concerned about the quality of their apps, they are very interested in your APIs. The Drupal-based developer portals includes an optional App Performance page designed to give app developers access to important metrics for their apps. This page gives developers information about:
- Errors: Which API errors is my app seeing?
- Performance: Is the API slow right now? Which API methods are typically slow or slow at the moment?
- Availability: Is the API up or down right now?
- Quota: Does your API have a quota? And as the app developer, how am I doing against the quota?
For more, see:
- Drupal 7: Displaying analytics for app usage
- Drupal 8: Monitor apps
- Integrated portal: not available
Additionally, you can share analytics with your developers by:
- Creating custom reports and sharing them with your app developers. For more information, see Create custom reports.
- Using the Edge management API to capture data over a wider period of time to share with app developers offline. For more information, see Use the metrics APIs to measure API program performance.
How do I generate complete analytics data?
What do we mean by complete analytics? You can, for example, create an API proxy and Edge will collect analytics data about that proxy. But what about metrics for the developer or app that called the API proxy? If Edge doesn't know who made an API call, it can't collect that data.
A few steps are required to let Edge figure out which developers and which developer apps are calling your API proxies. Here is a list of those steps with links to more detailed information:
- Create one or more API products, which is a grouping of API proxies along with a service plan. See Manage API products.
- Register app developers with Edge. See Register app developers.
- Register apps and generate API keys for your developers. See Register apps and manage API keys.
- Add security policies to your API proxies that verify API keys and/or security tokens. See the following topics:Verify API Key policy, OAuthV2 policy, and Verify JWT policy.
- If you're using Edge Microgateway, make sure that you've enabled the analytics plugin (which is enabled by default). If the analytics plugin is disabled, Edge Microgateway won't send analytics data to Edge analytics.
The following tutorials guide you through the necessary steps that let you see analytics for developers and apps: Secure an API by requiring API keys and Secure an API with OAuth.
Compare API Analytics to API Monitoring
You can take advantage of bothEdge API Monitoring and API Analytics. API Monitoring examines analytics data to provide real-time contextual insights into API performance, letting you quickly diagnose issues and facilitate remedial actions for business continuity. API Monitoring is designed for quickly finding trouble spots in your APIs and backends. API Analytics are designed to capture a wide range of analytics data for use by several different teams but the data is typically used for analysis in non-realtime scenarios.
One of the primary differences between API Monitoring and API Analytics is the alert mechanism built into API Monitoring. With alerts, you specify an HTTP status code (2xx/4xx/5xx), latency, or fault code threshold that, when exceeded, triggers an alert notification to your Ops Team. Alert notifications can be sent through a variety of channels, such as email, Slack, pagers, or webhooks, letting you respond to issues immediately.
See Compare API Monitoring with Edge API Analytics for a more detailed comparison between these services.
