
You're viewing Apigee Edge documentation.
Go to the
Apigee X documentation. info
Anomaly detection contains three main phases:
Train models
Anomaly detection works by training a model of the behavior of your API proxies from historical time-series data. There is no action required on your part to train the model. Edge automatically creates and trains models for you from the previous six hours of traffic data. Therefore, Edge requires a minimum of six hours of data on an API proxy to train the model before it can log an anomaly.
Log anomaly events
At runtime, Edge anomaly detection compares the current behavior of your API proxies with the behavior predicted by the model. Anomaly detection can then determine, with a specific confidence threshold, when an operational metric is exceeding the predicted value. For example, when the rate of 5xx errors exceeds the rate predicted by the model.
When Edge detects an anomaly condition, it automatically logs that condition to the Events dashboard in the Edge UI. For each anomaly detected, Edge logs the confidence thresholds of slight, moderate, or severe. For example, a severe anomaly is one which is considered anomalous with an extremely high confidence level.
The list of events displayed in the Events dashboard includes all anomalies detected by Edge and any triggered alerts. The alerts can be either fixed or anomaly alerts.
To view an anomaly:
- Click Analyze > Events in the Edge UI. The new Events dashboard appears:
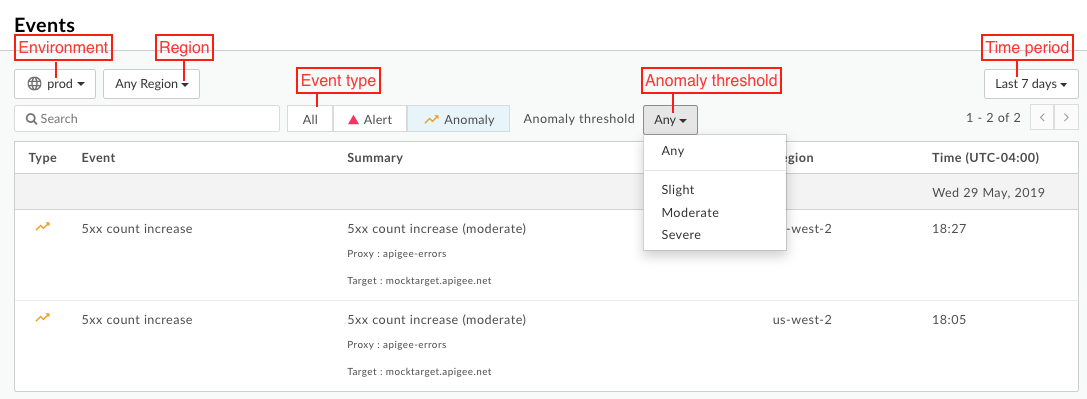
- Filter the Events dashboard by:
- Environment
- Region
- Event type as either Alert (fixed and anomaly) or Anomaly
- Anomaly threshold (anomalies only)
- Time period
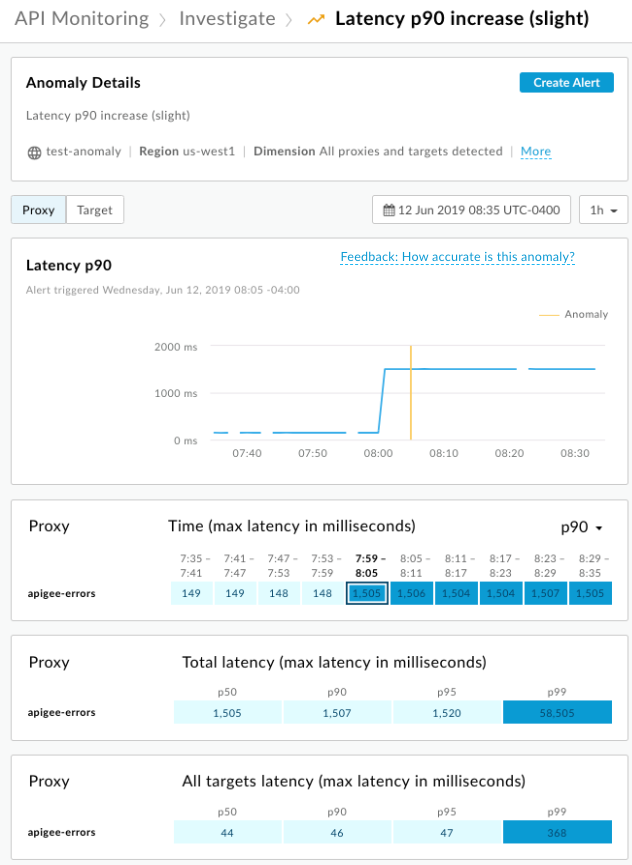
To drill down into an anomaly:
Select the row for the anomaly in the Events dashboard to open the anomaly in the API Monitoring Investigate dashboard. In the example below, you investigate an anomaly for a slight increase in p90 latency. The vertical yellow bar indicates where the anomaly occurred:
Select a block in the display to view the anomaly details:
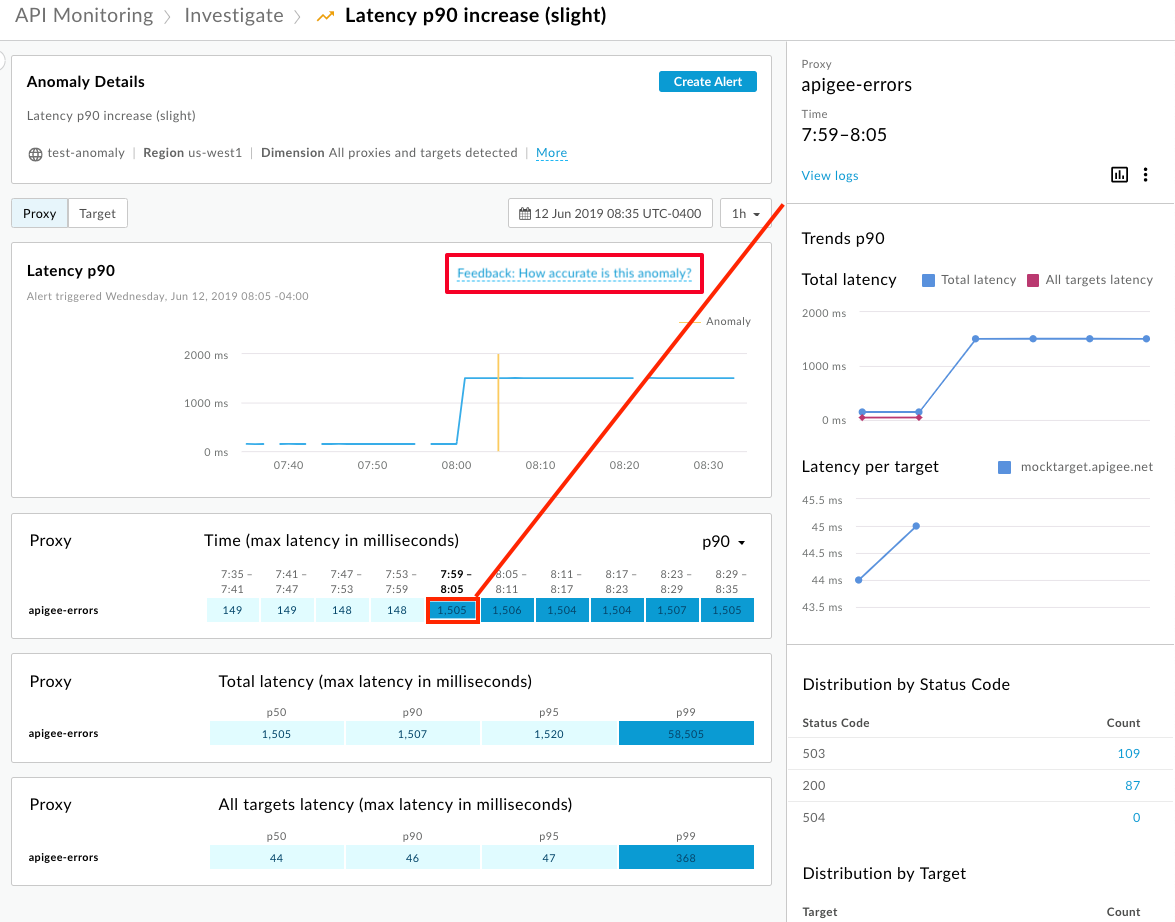
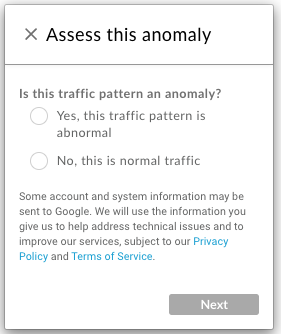
Select Feedback: How accurate is this anomaly to provide feedback to Apigee to help improve anomaly detection. Use this link to specify if the traffic pattern was an actual anomaly, how useful the detection was to you, and to leave an optional comment:
Generate alerts
By default, Edge generates an anomaly event, but does not raise an anomaly alert. It is up to you to examine the Events dashboard to determine if a detected anomaly, at the calculated threshold, is an actual issue. If so, you can then create an alert for that anomaly condition at the current or different threshold level. When the anomaly next occurs, Edge raises the alert and can then send you an email or other type of notification.
Note: After raising the alert, Edge does not raise the same alert again until 10 minutes have elapsed and the alert condition still exists. This interval prevents Edge from raising duplicate alerts for the same condition.
To create an anomaly alert:
- Select an anomaly in the Events dashboard to view the anomaly details as shown above.
- Select the Create Alert button in the anomaly details. The create alert panel opens.
Configure the alert. In the following example, you configure the alert for a slight increase in p90 latency for the
prodenvironment in any region: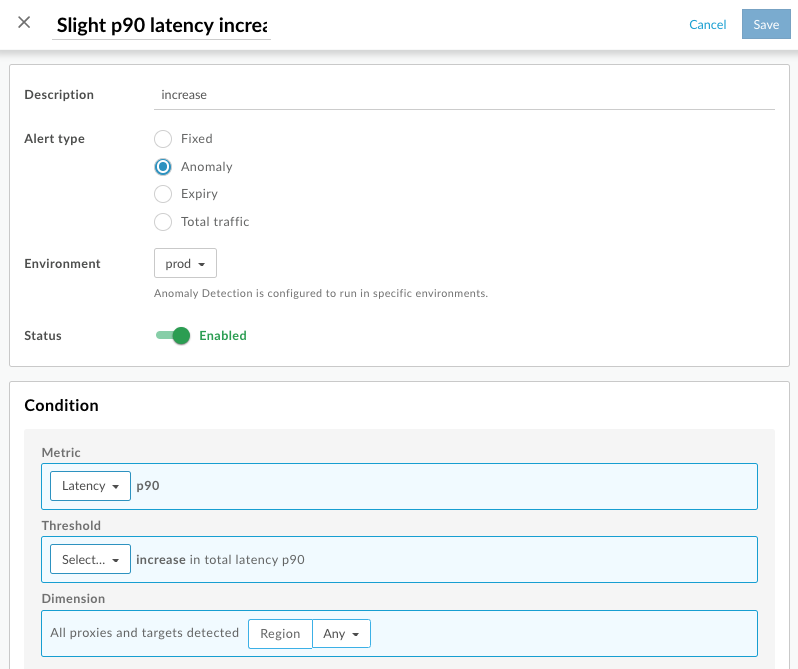
Click + Notification to add an alert notification.
Notification Details Description Channel Select the notification channel that you want to use and specify the destination: Email, Slack, PagerDuty, or Webhook. Destination Specify the destination based on the selected channel type:
- Email - Email address, such as joe@company.com
- Slack - Slack channel URL, such as https://hooks.slack.com/services/T00000000/B00000000/XXXXX
- PagerDuty - PagerDuty code, such as abcd1234efgh56789
Webhook - Webhook URL, such as https://apigee.com/test-webhook
Note: You can specify only one destination per notification. To specify multiple destinations for the same channel type, add additional notifications.
- To add additional notifications, repeat step 4.
- If you added a notification, set the following field:
Field Description Throttle Frequency with which to send notifications. Select a value from the drop-down list. Click Save.
You will be alerted the next time the anomaly occurs.