
You're viewing Apigee Edge documentation.
Go to the
Apigee X documentation. info
Use this walkthrough to understand how you can better understand current and potential security vulnerabilities. This topic describes the reports you'll see in the user interface, offering ways to think about security for your API proxies.
Only Organization Administrators and Read-Only Organization Administrator can access these reports in the Edge UI.
Reports available in Advanced API Ops
This page describes how to use security reports, including those provided to all Edge for Cloud Enterprise customers and those available only to Advanced API Ops customers. Edge for Cloud Enterprise customers who have not purchased Advanced API Ops will not have access to some of the reports described below.
See Introduction to security reporting for a complete list of reports availbe to all Enterprise customers and those available only to Advanced API Ops cusomters.
Get a snapshot of runtime activity and configuration
You can use the Overview page to get a security snapshot of configuration and runtime traffic, including potentially sensitive operations. With a picture of the largest amounts of activity -- particularly activity that represents a possible security vulnerability -- you can explore more detailed data about configuration and traffic.
To view runtime activity:
In the side navigation menu, click Analyze > Security Reporting > Overview.
In the upper-right corner, click the time period dropdown, then select the preceding period for which you want to view data:
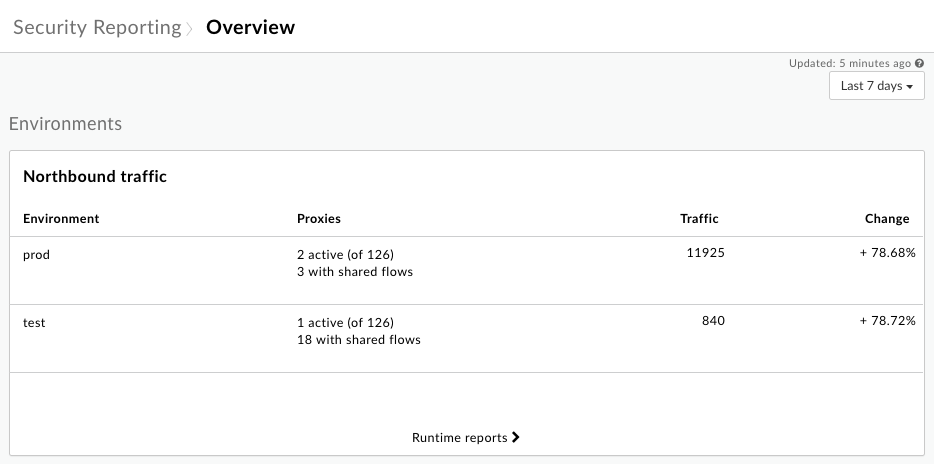
The Northbound traffic chart shows information about incoming requests to your API proxies for each environment in your organization.
To examine the incoming traffic in more detail, click Runtime reports to view detailed data on the Runtime page, which is described below.
Below the Northbound traffic chart, you'll find charts that show the Traffic by region (only when you have multiple regions), Error distribution by fault code, and Users by potentially sensitive operations (Organization Administrators only):
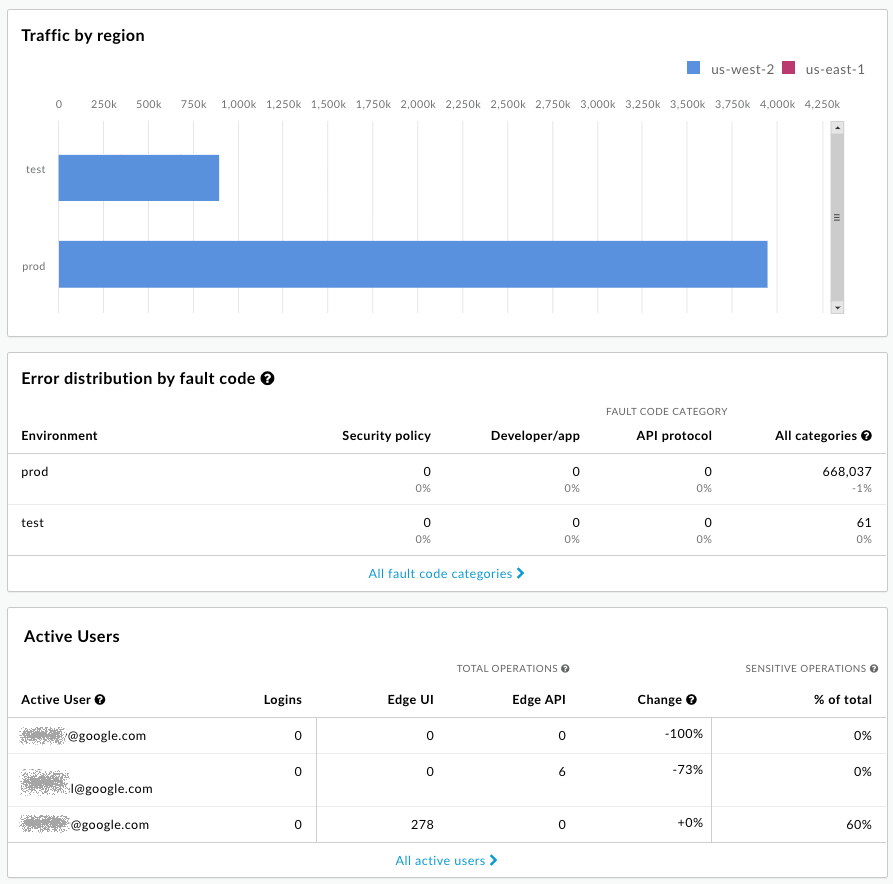
The email addresses are intentionally obscured in this image. See About sensitive operations below for a description of sensitive operations.
Ask questions about what you're seeing
The high-level snapshot provided by the Overview page helps you see prominent characteristics related to your system's security. Based on what you see, you might ask yourself the following questions:
- Does the percentage of requests exceed your expectations? Should you take a closer look at which API proxies are getting those requests?
- Does the percentage of traffic for each region seem correct? Is one region getting overloaded?
- Are you seeing a large number of fault codes? Where are they occurring?
- (Organization Administrators only) Which users are invoking the most potentially sensitive operations?
Get runtime traffic details
Use the Runtime page to view details about your runtime traffic and to identify current security vulnerabilities. For example, you can:
- Identify the amount of non-HTTPS traffic going to your proxies and targets.
- View details about the developer apps and virtual hosts servicing that traffic.
- View error count by fault code.
To view runtime traffic details:
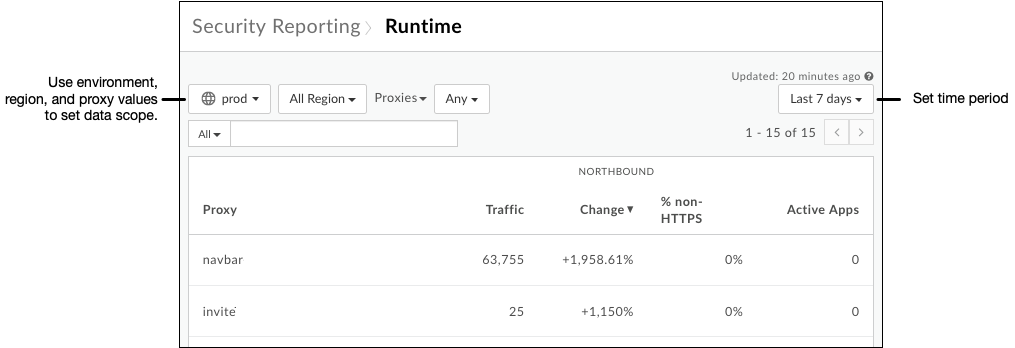
- In the side navigation menu, click Analyze > Security Reporting > Runtime.
- To set the scope for the data you want to see, at the top of the page select the environment, region, and time period for which you want to see data.
- Make sure the dropdown beside the environment dropdown says "Proxies" (not "Targets" or any other value -- you'll look at that below), and leave its value as "Any".
Note that the table lists API proxies within the scope you set, along with their total traffic for the period. In particular, notice the column listing non-HTTPS traffic. This represents requests sent to the listed proxy that are coming in over non-HTTPS, rather than HTTPS. This is a security vulnerability:
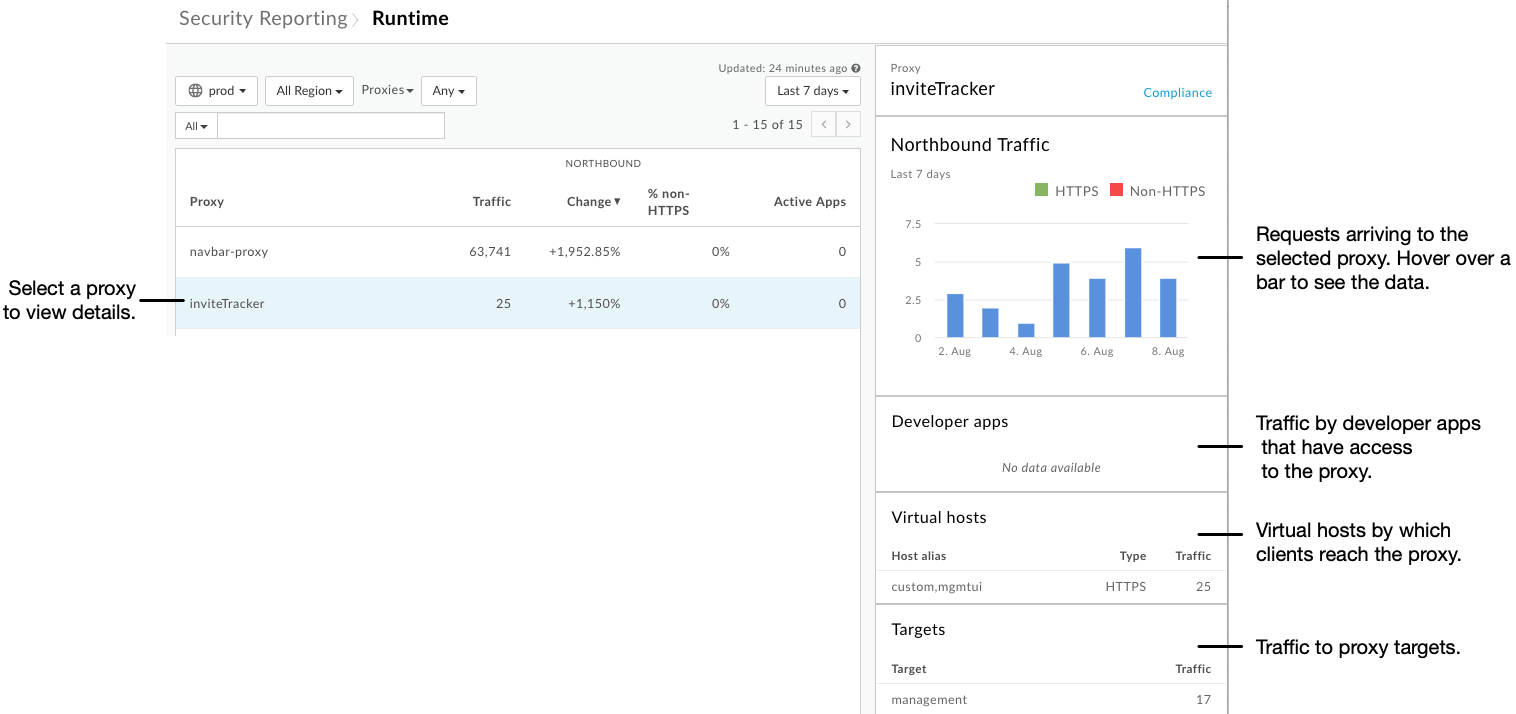
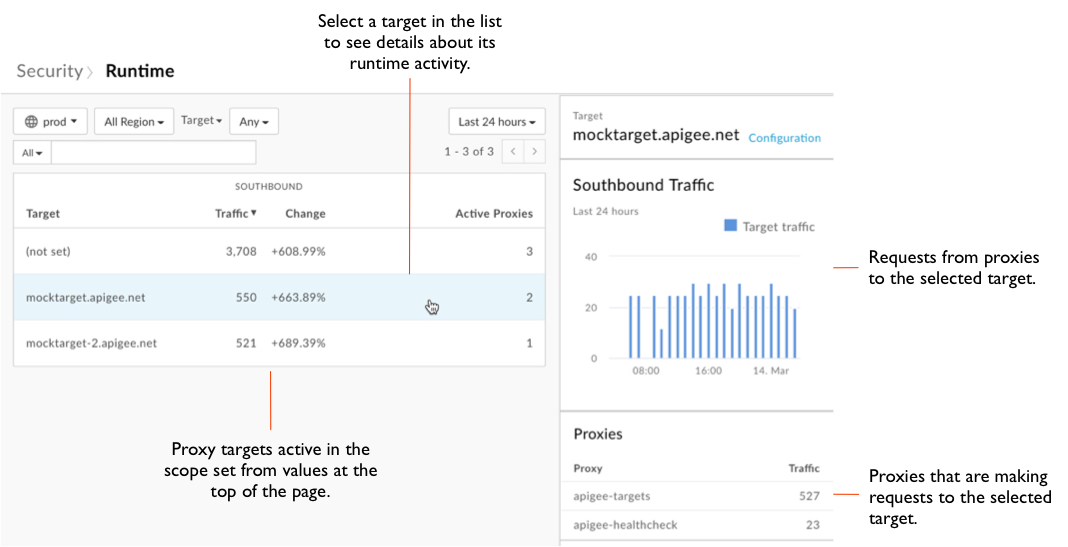
Click a row in the table to view more information about the proxy. As with the Total traffic chart, you can hover over bars in the Northbound Traffic chart to view the underlying data:
At the top of the page, click the Proxies dropdown, then click Targets.
Notice that the table lists similar information for proxy targets as the table listed for proxies.
Click a row in the table to view details about the target.
At the top of the page, click the Targets dropdown, then click Apps to view information about your apps.
At the top of the page, click the Apps dropdown, then click Fault codes to view information about fault codes.
Ask questions about what you're seeing
The Runtime page illustrates how your proxies are behaving in the current traffic context -- requests from clients, requests to targets. Use what's shown to ask yourself questions about whether your proxies are behaving as they should.
- Look at the details for each proxy receiving non-HTTPS traffic. Does the portion of that traffic seem appropriate for that proxy? Should the proxy be reconfigured to receive requests over HTTPS?
- Look at the data from a variety of scopes, such as more or less history. Is there a trend you could be responding to?
- Are there any significant increases in traffic from a proxy to a target? Should that traffic be mediated by traffic management policies?
Get configuration details
With details about configuration from a security perspective, you can start to identify places where you can improve security by changing how your proxies are configured. The Configuration page gives you a detailed view of how your proxies and targets use the tools available in Apigee Edge.
To view configuration details:
- In the side navigation menu, click the Analyze > Security Reporting > Configuration menu item.
- To set the scope for the data you want to see, at the top of the page select the environment for which you want to see data.
- Make sure the dropdown beside the environment dropdown says "Proxies" (not "Targets" or other values), and leave its value as "Any".
- For each proxy, the table indicates:
- The number of policies used from the security-related policy groups. The policy groups are traffic management, security, and extension. For more about the groups, see Policy reference overview.
- The number of shared flows, if any, used by a proxy.
- Whether a proxy's virtual hosts are set up to receive Non-HTTPS requests, HTTPS requests, or both.
Click a row in the table to view more information about the proxy's configuration:
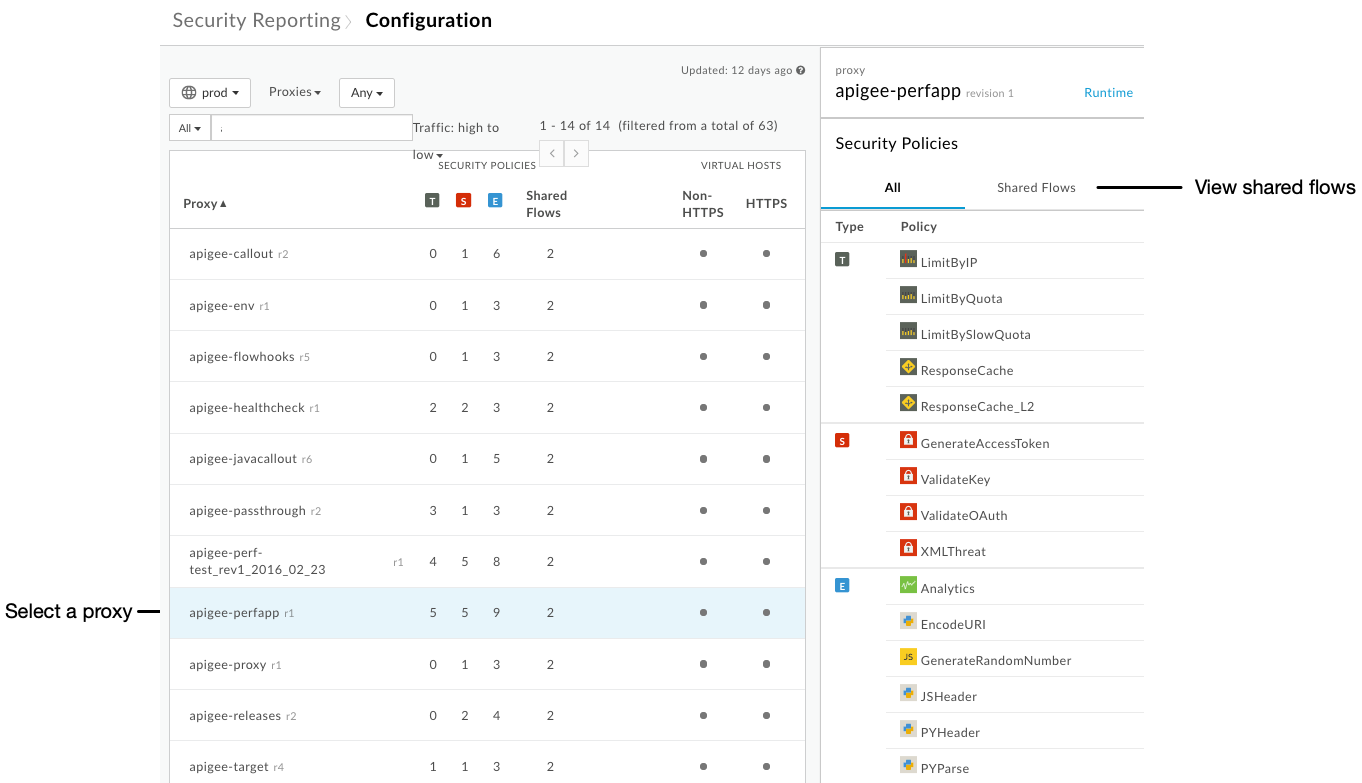
If the proxy you've selected includes shared flows, on the right side of the UI click Shared Flows to view the list of security-related policies that are configured in shared flows called by this proxy.
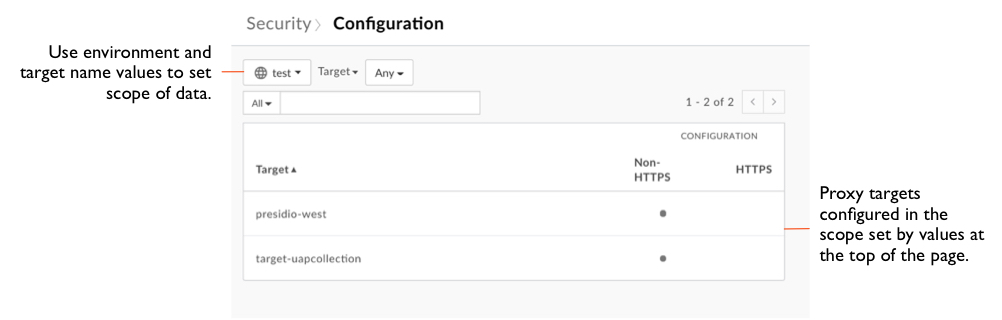
At the top of the page, click the Proxies dropdown, then click Targets.
Notice that the table indicates whether targets are being reached by non-HTTPS or HTTPS calls:
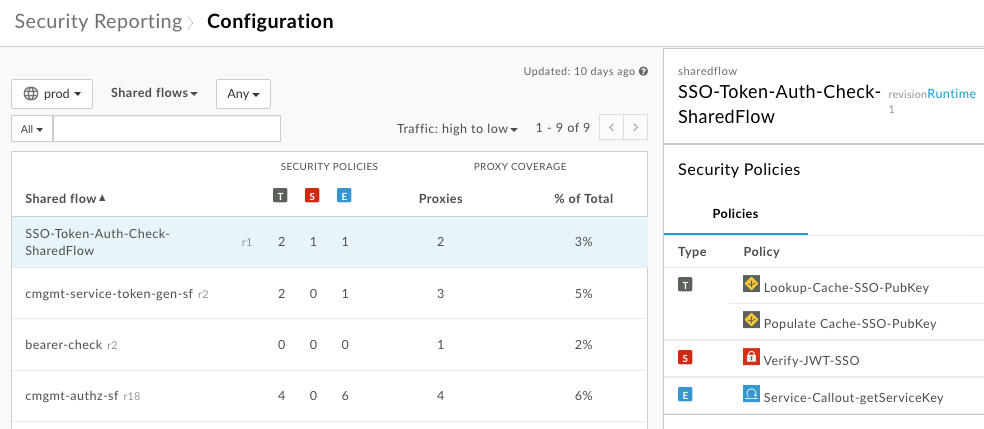
At the top of the page, click the Targets dropdown, then click Shared flows to view information about shared flows, including:
- The number of policies used from the security-related policy groups.
- The number of proxies using each shared flow.
Ask questions about what you're seeing
Where the Runtime page illustrates how your proxies are behaving in runtime conditions, the Configuration page illustrates how you've configured them to handle those conditions. In looking over the reports, take a closer look at each proxy.
- Do your proxies have the appropriate security policies included? Not all proxies should be configured identically when it comes to security. For example, a proxy receiving a heavy request load, or whose request quantity fluctuates dramatically, should probably have traffic control policies such as the SpikeArrest policy configured.
- If shared flow use is low, why is that? Shared flows can be a useful way to create reusable security-related functionality. For more about shared flows, see Reusable shared flows.
- Are you using shared flows attached to flow hooks? By attaching a shared flow that contains security-related policies to a flow hook, you can have that security functionality enforced across proxies in an environment. For more about flow hooks, see Attaching a shared flow using a flow hook.
- Should the proxy be allowed to have a non-HTTPS virtual host?
Get user activity details
As part of monitoring security, be aware of the potentially sensitive operations performed by users. The User Activity page lists the count of sensitive operations performed by users. See About sensitive operations below for a description of sensitive operations.
Only Organization Administrators who have purchased Advanced API Ops can access the User Activity page. No other roles, including Read-Only Organization Administrator, can access this page
To view user activity:
- In the side navigation menu, click the Analyze > Security Reporting > User Activity menu item.
- Click the date box to set the date range.
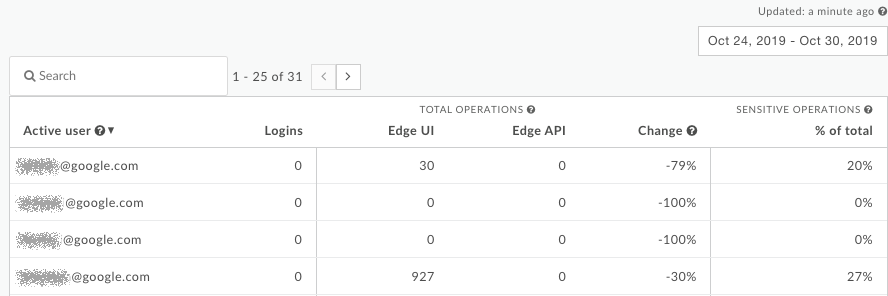
For each user in the organization, the table shows (email addresses intentionally obscured):
- The number of logins.
- The number of sensitive operations performed by the user through the UI or API.
- The change in activity over the selected time range.
- The percentage of all operations performed by the user that are considered sensitive.
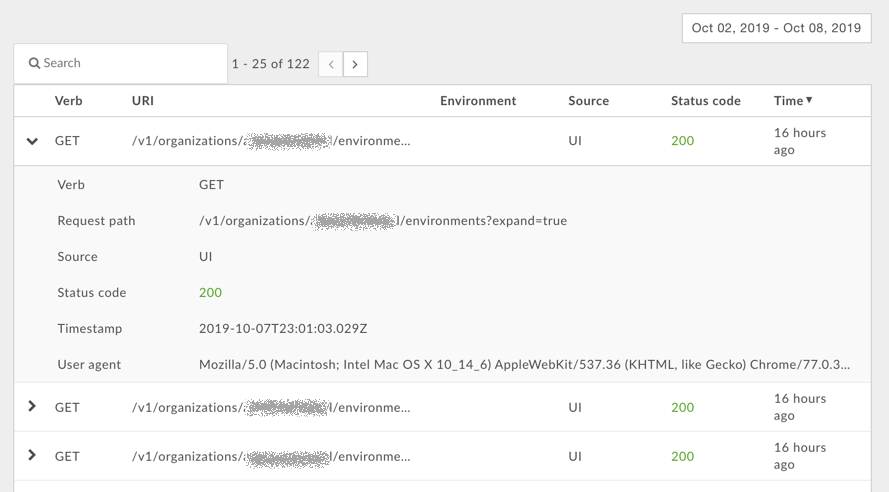
Click a row in the table to display detailed information about the user's activity:
About sensitive operations
The Overview page and the User Activity page both display information about sensitive operations performed by users. A sensitive operation is any operation in the UI or API that performs a GET/PUT/POST/DELETE action on the following API patterns:
| Use case | Request URI pattern |
|---|---|
| Accessing developers | /v1/organizations/org_name/developers* |
| Accessing apps | /v1/organizations/org_name/apps* |
| Accessing custom reports | /v1/organizations/org_name/environments/env_name/stats* |
| Accessing trace sessions | /v1/organizations/org_name/environments/env_name/apis/proxy/revisions/rev/debugsessions* |
| Accessing virtual hosts | /v1/organizations/org_name/environments/env_name/virtualhosts* |
For these patterns, the * character corresponds to any resource path. For example, for the URI pattern:
/v1/organizations/org_name/developers*
Edge tracks GET/PUT/POST/DELETE actions on the following URIs:
/v1/organizations/org_name/developers
/v1/organizations/org_name/developers/developer_email
/v1/organizations/org_name/developersdeveloper_email/attributes/attribute_name
Ask questions about what you're seeing
The User Activity page provides a way to drill down into the activity of organization users. For each user you can ask yourself:
- Is the number of logins appropriate for the user?
- Is the user performing a large number of sensitive operations? Are these the expected operations that this user should be performing?
- Has the activity of the user changed over a time period? Why has the percentage changed?