You're viewing Apigee Edge documentation.
Go to the
Apigee X documentation. info
What is the Offline Trace tool?
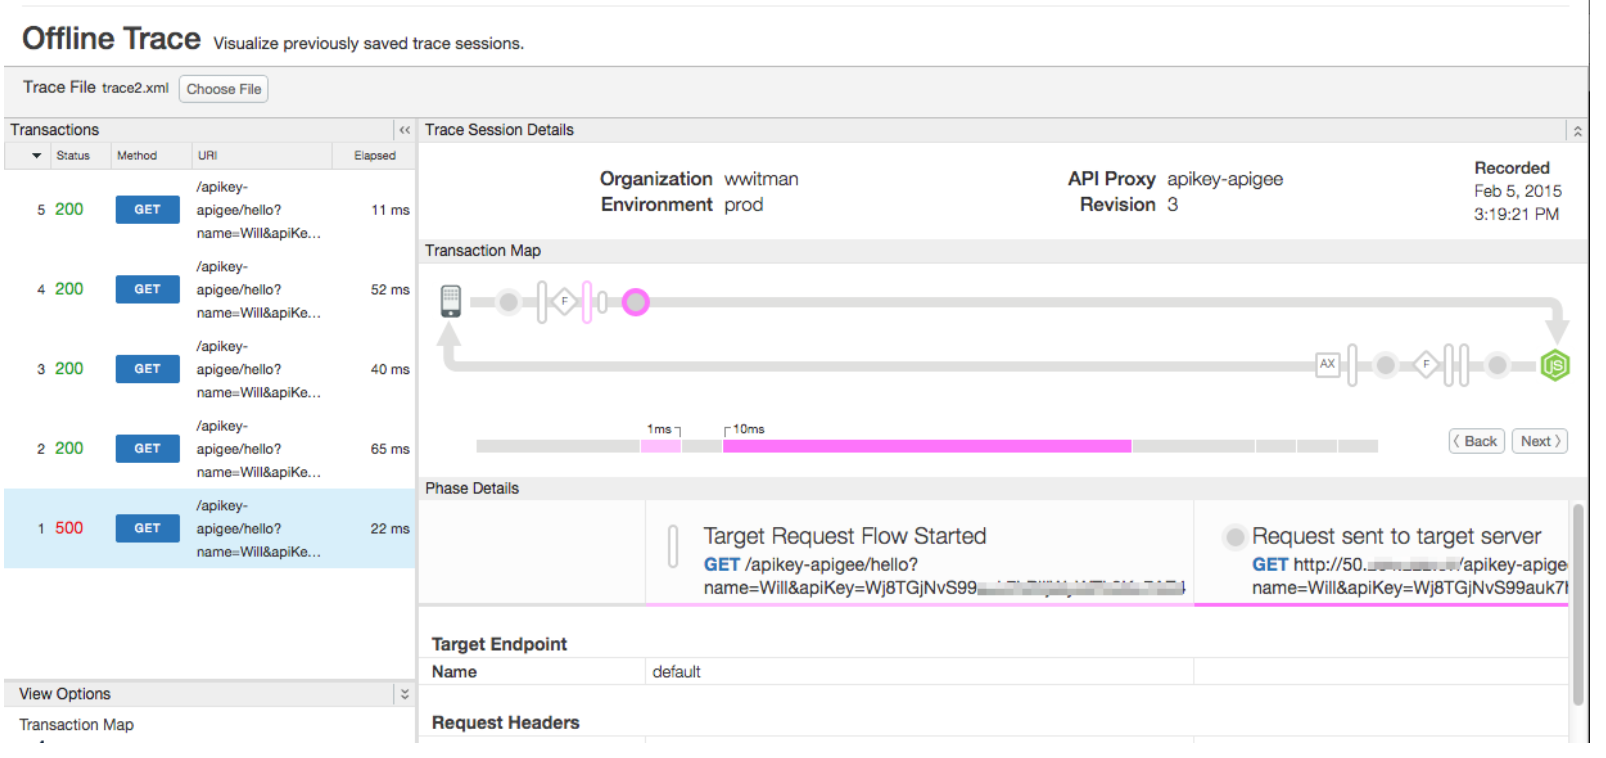
The Offline Trace tool lets you view and analyze trace sessions that were previously saved. A saved trace session is essentially a "recording" of a trace session, and can be useful for cases where troubleshooting and further analysis is required. The UI for the Offline Trace tool is similar to the "live" Trace tool. To learn about the Trace Tool UI and on saving trace sessions, see Using the Trace tool.
Downloading a trace session
To download a trace session:
- Open the Trace Tool, as described in Using the Trace tool.
- Perform a trace.
- When the trace is completed, select Download Trace Session.
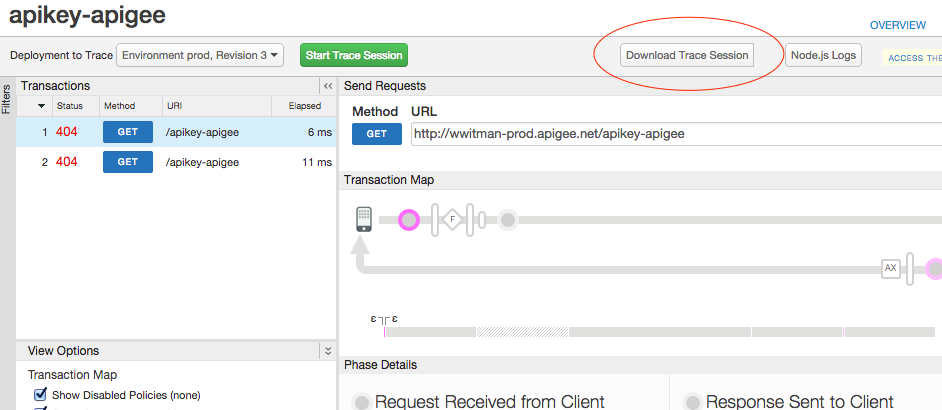
The downloaded trace is stored in XML format.
Accessing the Offline Trace tool
Access the Offline Trace tool, as described below.
Edge
To access the Offline Trace tool using the Edge UI:
- Sign in to apigee.com/edge.
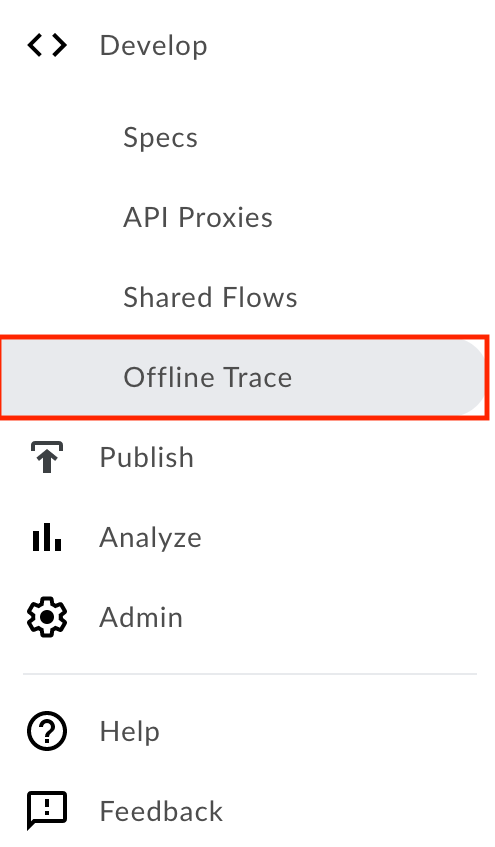
- Select Develop > Offline Trace in the left navigation bar.
Classic Edge (Private Cloud)
To access the Offline Trace tool using the Classic Edge UI:
- Sign in to
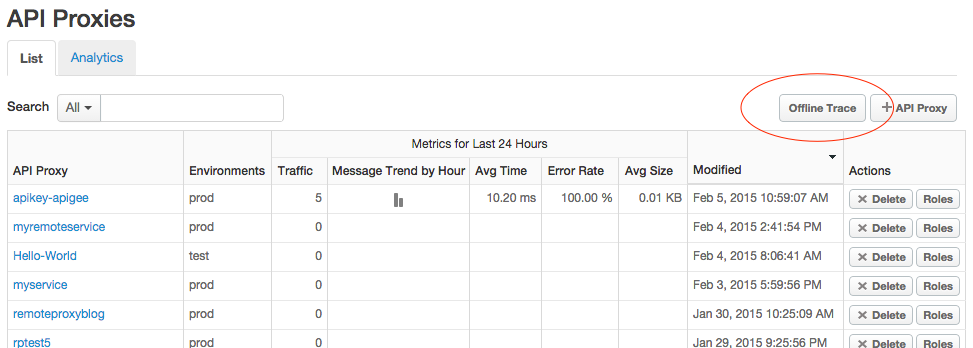
http://ms-ip:9000, where ms-ip is the IP address or DNS name of the Management Server node. - Select APIs > API Proxies in the top navigation bar.
- On the API proxies page, click Offline Trace.
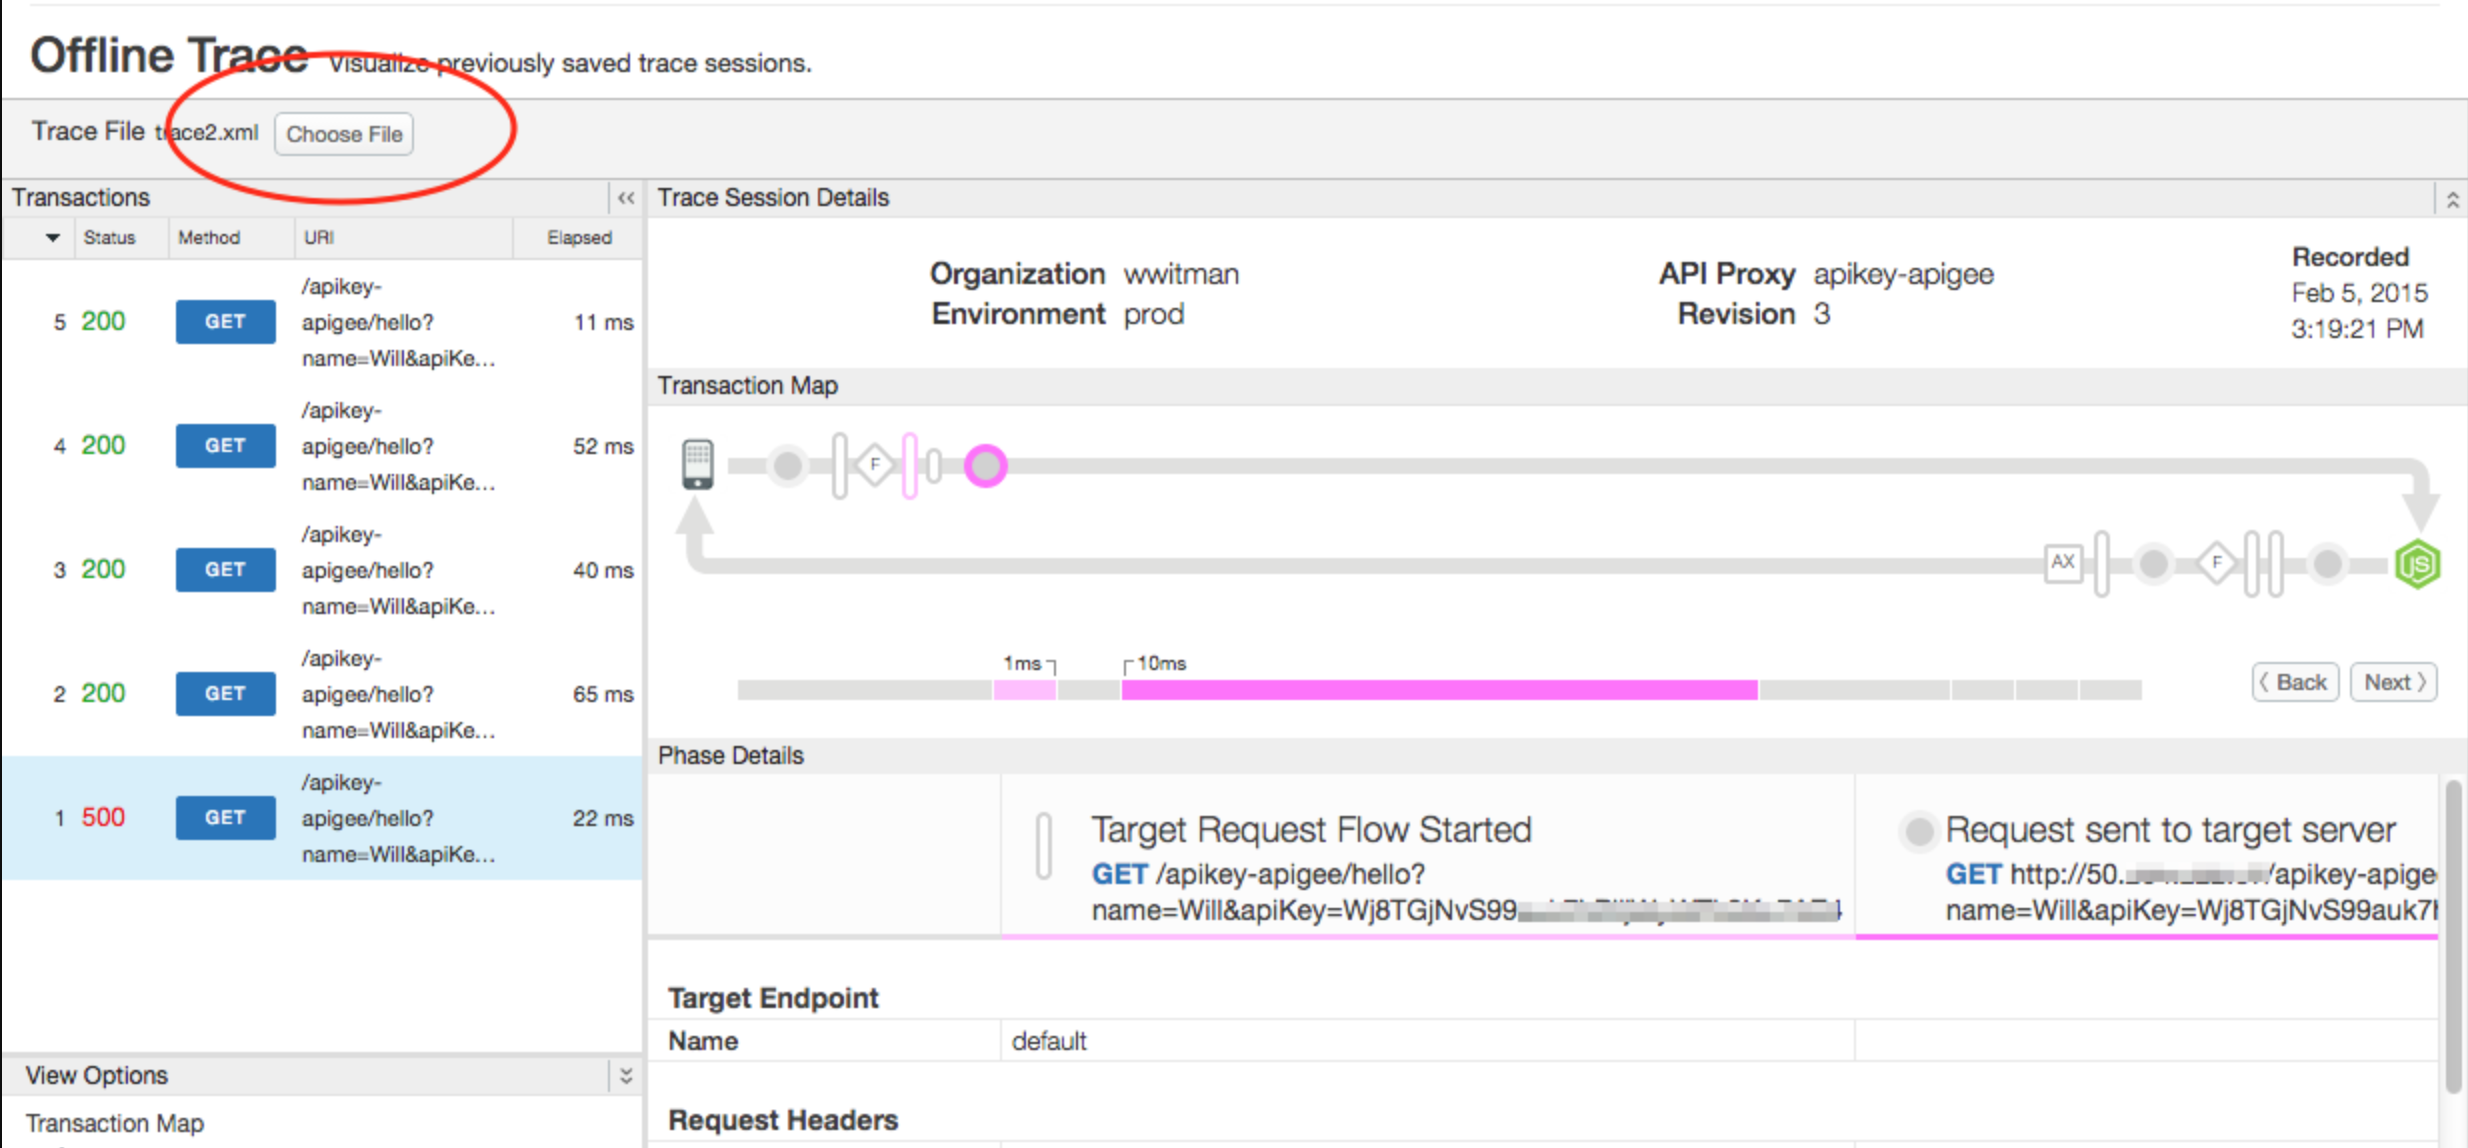
Loading a trace file
In the Offline Trace tool, click Choose File and select a downloaded trace file from your system.