You're viewing Apigee Edge documentation.
Go to the
Apigee X documentation. info
It's a good practice to make sure any Node.js code you add to a proxy works before you deploy it to Edge. This topic discusses ways to debug and troubleshoot proxies that include Node.js applications after they are deployed.
Increasing connection pool size to improve performance
If you notice slow performance, you may be able to solve the problem by increasing the default Node.js connection pool size with maxSockets, or by disabling socket pooling altogether. For more information and example code, see Node.js Performance Tips: Socket Pooling in the Apigee Community.
Viewing Node.js logs
To view log information about your Node.js application:
- In the main API proxies page, click on the proxy you wish to view.
- In the summary page of the selected proxy, click Node.js Logs on the right-hand side of the tool bar.
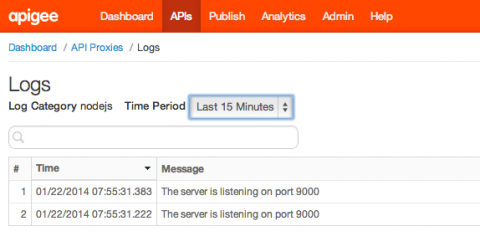
In the Logs page, you can select a time range of logs to view, as shown below. The logs record HTTP method calls, success or failure of calls, console.log messages, and so on. Enter a search string in the search field to display all log entries that contain the string.

Using the trace tool
The trace tool is useful for general proxy debugging. For detailed information on using the trace tool, see Using the Trace tool.
Printing console output
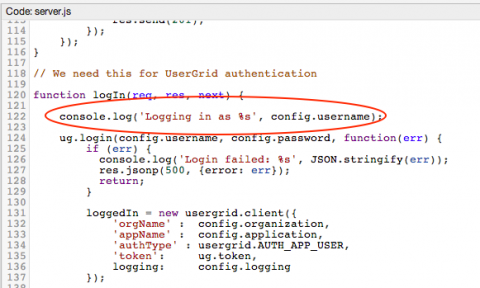
You can embed console.log statements in your Node.js code and view the output in the trace tool. For example, the following statement prints the value of the variable config.user:
console.log('Logging in as %s', config.username);

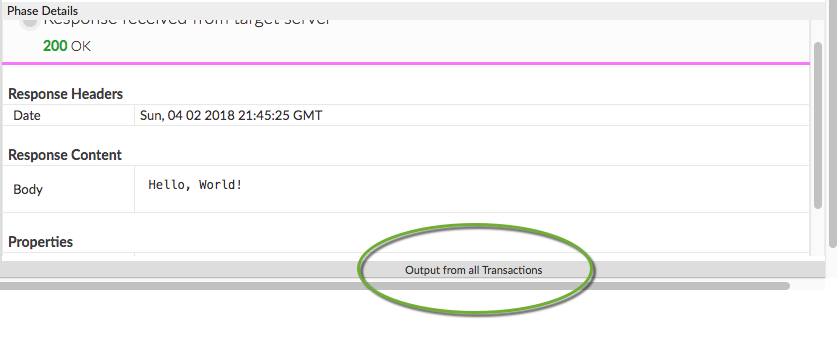
To view the output of console.log messages in the trace tool, call your API in the Trace Tool and click Output from all Transactions to open the output panel:

Assuming you executed the following code...
var http = require('http');

console.log('node.js application starting...');

var svr = http.createServer(function(req, resp) {
    resp.end('Hello, World!');
});

svr.listen(9000, function() {
    console.log('Node HTTP server is listening');
});
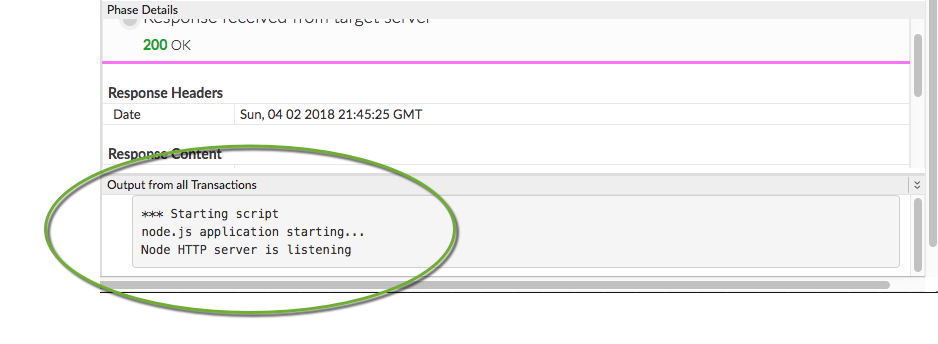
... the console statements appear in the panel:

Configuring Nginx target timeout settings
If you are using Nginx as a proxy and see "Bad Gateway" errors, try increasing the Nginx proxy timeout configuration as explained here:
For example:
proxy_connect_timeout       60;
proxy_read_timeout          120;
Depending on how long the server takes to respond can determine your ideal timeout configurations. For example, a read timeout of 45-60 seconds might be ideal to provide a reasonable buffer.
Configuring Apigee target timeout settings
You can also configure the Apigee default timeout values in the HttpTargetConnection element in the TargetEndpoint. The default values are:
connect.timeout.millis - 60 seconds
io.timeout.millis - 120 seconds
<HTTPTargetConnection>
    <Properties>
        <Property name="connect.timeout.millis">5000</Property>
        <Property name="io.timeout.millis">5000</Property>
    </Properties>
    <URL>http://www.google.com</URL>
</HTTPTargetConnection>
See also Endpoint properties reference.
For more information
To learn more about debugging, see:
- Using the Trace tool
- Using performance metrics
- Troubleshooting introduction
- Audits: API, Product, and organization history
Next steps
For information about Node.js module support in Apigee Edge, including information about support for HTTP/HTTPS, TLS, and other advanced topics, see Understanding Edge support for Node.js modules.
