You're viewing Apigee Edge documentation.
Go to the
Apigee X documentation. info
What is the Trace tool?
Trace is a tool for troubleshooting and monitoring API proxies running on Apigee Edge. Trace lets you probe the details of each step through an API proxy flow.
Watch this video for an introduction to the Trace tool.
How to use Trace
Trace is simple to use. You start a trace session, then make an API call to the Edge platform, and read the results.
- Access the API proxies page, as described below.
Edge
To access the API proxies page using the Edge UI:
- Sign in to apigee.com/edge.
- Select Develop > API Proxies in the left navigation bar.
Classic Edge (Private Cloud)
To access the API proxies page using the Classic Edge UI:
- Sign in to
http://ms-ip:9000, where ms-ip is the IP address or DNS name of the Management Server node. - Select APIs > API Proxies in the top navigation bar.
- Select an API proxy from the API Proxies page.
- Be sure the API you wish to trace is deployed.
- Click Trace to go to the Trace tool view.
- Use the Deployment to Trace dropdown menu to select which deployment environment and proxy revision you wish to trace.
- Click Start Trace Session. When the Trace session is active, the API proxy
records details of each step in the processing pipeline. While the Trace session is running,
messages and contextual data are captured from live traffic.

- If you don't have any live traffic flowing through your proxy, then simply send a request
to the API. You can use whatever tool you wish to send the request, such as curl, Postman, or
any familiar tool. Or, you can send the request directly from the Trace tool itself. Just enter
the URL and click Send. Note: You can only send a GET request from
the Trace tool, but not a POST request.
Note: One Trace session can support 10 request/response transactions per message processor through the selected API proxy. In Edge cloud, with 2 messages processors handling traffic, 20 request/response transactions are supported. A trace session automatically stops after 10 minutes if you don't manually stop it.
- When you've captured a sufficient number of requests, click Stop Trace Session.
- A list of captured request/response transactions displays in the left menu. Click on any of the transactions to view detailed results.
How to read a trace
The trace tool has two main parts, the transaction map and the phase details:
- The transaction map uses icons to mark each notable step that occurs during an API proxy transaction, including policy execution, conditional steps, and transitions. Hover over any icon to see summary information. The request flow steps appear along the top of the transaction map and response flow steps along the bottom.
- The phase details section of the tool lists information about the proxy's internal processing, including variables that were set or read, request and response headers, and much more. Click any icon to see the phase details for that step.
Here's a sample trace tool map with the main proxy processing segments labeled:
Trace tool's transaction map
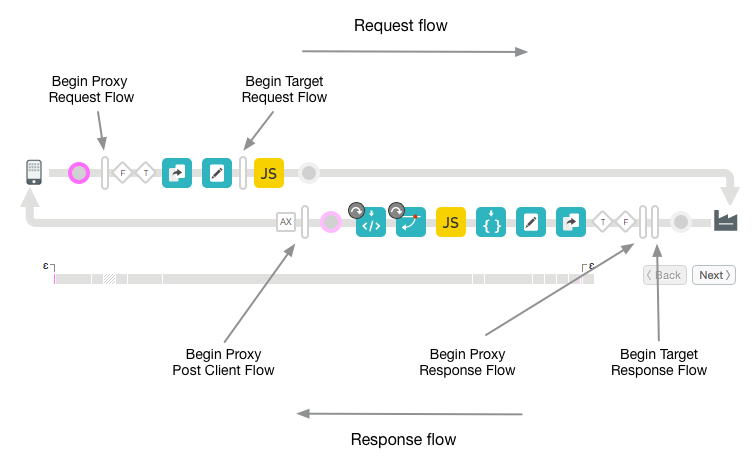
Transaction map legend
The following table describes the intent of the icons you will see in the transaction map. These icons mark each of the notable processing steps throughout the proxy flow.
Transaction map icons
 |
The client app that sends a request to the ProxyEndpoint of the API proxy. |
| The circles mark transitional endpoints in the proxy flow. They are there when a request comes in from the client, when the request goes to the target, when the response comes back from the target, and when the response goes back to the client. | |
|
The tall bars indicate the beginning of a flow segment in the API proxy flow. Flow segments are: ProxyEndpoint request, TargetEndpoint request, TargetEndpoint response, and ProxyEndpoint response. A segment includes the PreFlow, Conditional Flows, and PostFlow. See Configuring flows for more information. |
|
|
Indicates that Analytics actions have occurred in the background. |
|
|
A conditional flow that evaluates to true. For an introduction to conditional flows, see Configuring flows. Note that some conditions are Edge-generated. For example, the following is an expression that Edge uses to check if an error occurred in the ProxyEndpoint: ((error.state equals PROXY_REQ_FLOW) or (error.state equals
PROXY_RESP_FLOW))
|
|
|
A conditional flow that evaluates to false. For an introduction to conditional flows, see Configuring flows. Note that some conditions are Edge-generated. For example, the following is an expression that Edge uses to check if an error occurred in the TargetEndpoint: (((error.state equals TARGET_REQ_FLOW) or (error.state equals
TARGET_RESP_FLOW)) or ((error.state equals REQ_SENT) or (error.state equals
RESP_START)))
|
|
|
|
Policies. Each type of policy has a unique icon. This one is for the AssignMessage policy. These icons let you see where policies are executed in the proper order and if they are successful or not. You can click a policy icon to see the results of its execution and if they are expected or not. For example, you can see if the message was transformed properly or if it is being cached. Properly executing policies are clearly indicated by check-marks. In the case of an error, a red exclamation mark is displayed on the icon. Tip: Pay attention to the tooltip or the time line to see if any policy is taking longer than expected. |
 |
Appears when the backend target is a Node.js application. See Overview of Node.js on Apigee Edge. |
 |
The backend target called by the API proxy. |
 |
The time line indicates how long (in milliseconds) that the processing time took to complete. Comparing the elapsed time segments helps you isolate the policies that are taking the longest to execute that are slowing down your API calls. |
| The Epsilon indicates a time-span smaller than a millisecond. | |
|
Disabled. Appears on a policy icon when a policy is disabled. A policy can be disabled with the public API. See API proxy configuration reference. |
|
| Error. Appears on a policy icon when the Policy Step condition evaluates to false (see Flow variables and conditions), or on the RaiseFault policy icon whenever a RaiseFault policy executes. | |
| Skipped. Appears on a policy icon when the policy was not executed because the step condition evaluated to false. See Flow variables and conditions for more information. |
Understanding the phase details
The Phase Details part of the tool tells you a lot about the state of your proxy at each processing step. Here are some of the details provided in the Phase Details. Click any icon in the trace tool to see details for the selected step, or use the Next/Back buttons to move from one step to another.
| Phase Detail | Description |
| Proxy Endpoint | Indicates which ProxyEndpoint flow was selected for execution. An API proxy can have multiple named proxy endpoints. |
| Variables |
Lists the flow variables that were read and assigned a value by a policy, See also Managing proxy state with flow variables. Note:
|
| Request Headers | Lists the HTTP request headers. |
| Request Content | Shows the HTTP request body. |
| Properties | Properties represent the internal state of the API proxy. These are not shown by default. |
| Target Endpoint | Indicates which TargetEndpoint was selected for execution. |
| Response Headers | Lists the HTTP response headers. |
| Response Content | Shows the HTTP response body. |
| PostClientFlow | Shows information about the PostClientFlow, which executes after the request is returned to the requesting client app. Only MessageLogging policies can be attached to the PostClientFlow. The PostClientFlow is currently used primarily for measuring the time interval between the start and end timestamps for the response message. |
Refining message capture using filters
You can filter which requests show up in the Trace tool by specifying header and/or query parameter values. Filters enable you to target specific calls that may be causing problems. For example, you may need to zero in on requests that have specific content or requests coming from specific partners or apps. You can filter on:
- HTTP headers - Limit the trace to only calls that contain a specific header. This is a good way of helping you troubleshoot issues. You can send a header to your app developer and ask them to include it in the call that is causing issues. Then Apigee Edge will only record calls with that specific header so you can examine the results.
- Query parameters - Only calls with a specific value of a parameter will be recorded.
Things you need to know about the Filter feature
- You must restart your Trace session after specifying filter parameters in the filter fields.
- Filter parameters are AND'ed together. All specified query and/or header name/value pairs must be present in the request for a successful match.
- Pattern matching is not supported in the Filters tool.
- Filter parameters and values are case sensitive.
How to create a trace filter
- If a trace session is running, stop it by clicking Stop Trace Session.
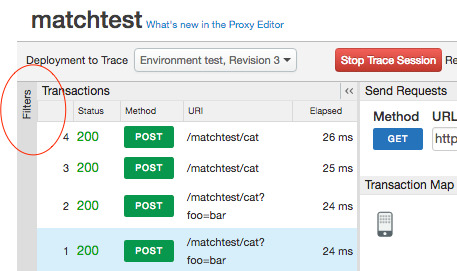
- Click Filters in the upper-left corner of the Trace tool to expand the
Filters field.
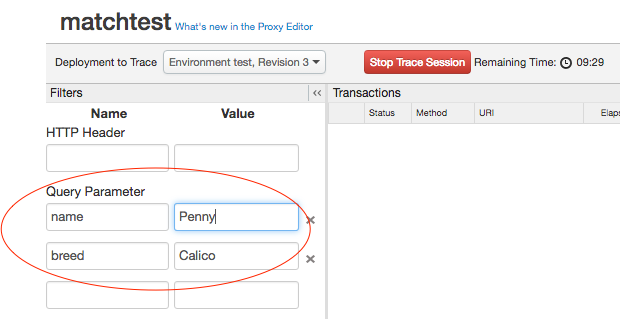
- In the Filters field, specify the query parameter and/or header values you wish to filter
on. In this example, we specify two query parameters to filter on. Both parameters must be
present in the request for a successful match.
- Start the trace session.
- Call your APIs. Only requests that include all of the specified header(s) and/or query parameter(s) produce a successful match.
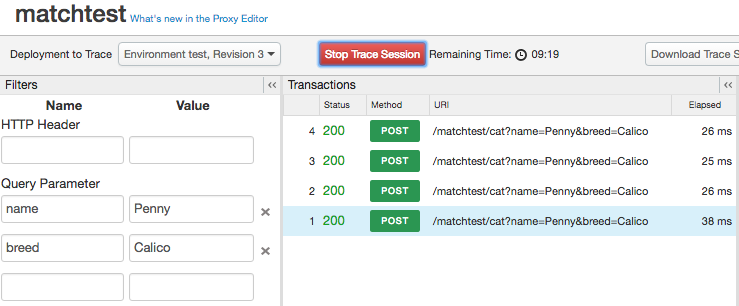
In the above example, this API call will show up in Trace:
http://docs-test.apigee.net/cats?name=Penny&breed=Calico
But this will not:
http://docs-test.apigee.net/cats?name=Penny
Debugging with Trace
Trace lets you see a lot of internal details about an API proxy. For example:
- You can see at a glance which policies are executing correctly or failing.
- Let's say you noticed through one of the Analytics dashboards that one of your APIs is experiencing an unusual decrease in performance. Now, you can use Trace to help identify where the bottleneck is occurring. Trace gives the time, in milliseconds, that it takes for each processing step to complete. If you find one step is taking too long, you can take corrective action.
- By looking at the phase details, you can check headers that are being sent to the backend, view variables set by policies, and so on.
- By verifying the base path, you can ensure that a policy is routing the message to correct server.
Selecting View Options
Choose the view options for the trace session.
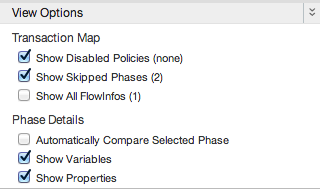


| Option | Description |
| Show Disabled Policies | Show any disabled policies. A policy can be disabled with the public API. See API proxy configuration reference. |
| Show Skipped Phases | Show any phases that were skipped. A skipped phase occurs when policy was not executed because the step condition evaluated to false. See Flow variables and conditions for more information. |
| Show all FlowInfos | Represent transitions within a flow segment. |
| Automatically Compare Selected Phase | Compares the selected phase to the previous one. Turn this off to see only the selected phase. |
| Show Variables | Show or hide variables that were read and/or assigned a value. |
| Show Properties | Properties represent the internal state of the API proxy. (Hidden by default.) |
Downloading trace results
You can download an XML file of raw trace results for viewing and searching offline in a text editor. The file shows the complete details of the listening session including the contents of all headers, variables, and policies.
To download, click Download Trace Session.
Showing requests as curl
After you trace an API call made to a target server, you can view the request as a curl command. This is particularly useful for debugging for a couple of reasons:
- The API proxy may modify the request, so it's useful to see how request from the proxy to the target server differs from the original request. The curl command represents the modified request.
- For larger message payloads, the curl allows you to see the HTTP headers and message content in a single place. (There's currently a limit of about 1,000 characters. For a tip on getting past this limit, see this community post.)
For security, the curl feature masks the HTTP Authorization header.
To see requests as curl after an API call comes through in Trace, select the "Request sent to target server" stage in the Transaction Map diagram, then click the Show curl button on the "Request sent to target server" column in the Phase Details pane.

Apigee Support use of Trace
By default, Apigee Edge allows Apigee Support to use the Trace tool on your API proxies to provide support. You may disable this option at any time. However, disabling this option may limit Apigee Support's ability to provide you with support.
To disable Apigee Support from using the Trace tool:
- Sign in to https://apigee.com/edge.
- Select Admin > Privacy & Security in the left navigation bar.
- Click the Enable Apigee Support to Trace toggle to disable use of the Trace tool by Apigee Support.
