You're viewing Apigee Edge documentation.
Go to the
Apigee X documentation. info
Symptom
The client application receives an HTTP 400 Bad Request response with the message
The plain HTTP request was sent to HTTPS port.
Error message
The client application gets the following response code:
HTTP/1.1 400 Bad Request
Followed by the below HTML error page:
<html>
<head><title>400 The plain HTTP request was sent to HTTPS port</title></head>
<body>
<center><h1>400 Bad Request</h1></center>
<center>The plain HTTP request was sent to HTTPS port</center>
</body>
</html>
Possible causes
| Cause | Description | Troubleshooting instructions applicable for |
|---|---|---|
| HTTP request to a TLS-configured virtual host | The client sends HTTP request to a TLS-configured virtual host | Edge Public and Private Cloud users |
| HTTP request to a TLS-configured target endpoint | HTTP request made to a TLS-enabled backend server in target endpoint. | Edge Public and Private Cloud users |
| Incorrect target server configuration | Target server is configured with secure port 443 but SSL is not enabled. |
Edge Public and Private Cloud users |
Cause: HTTP request to a TLS-configured virtual host
This error occurs when a client is trying to connect to an API on Apigee and the mentioned virtual host is configured to use SSL and receives an HTTP request instead.
Diagnosis
Since this issue occurs on the Northbound endpoint and the API requests fail at the entry point interaction between the client application and the Router, these error messages are not logged in the NGINX router access logs. Therefore, these requests will not be captured in tools like API Monitoring and the Trace tool.
-
Verify your API request and see if you are making an HTTP request for a host alias that is configured to accept requests only on the secure port
443. If so, then that’s the cause of the issue.Sample incorrect API request:
curl http://org-test.apigee.net:443/400-demo
<html>
<head><title>400 The plain HTTP request was sent to HTTPS port</title></head>
<body>
<center><h1>400 Bad Request</h1></center>
<center>The plain HTTP request was sent to HTTPS port</center>
<hr><center>server</center>
</body>
</html>
- In the above sample request, note that an HTTP request is made to the host alias
myorg-test.apigee.neton secure port443. This is the cause for the400 Bad Requesterror.
Resolution
You need to verify if the client is using HTTP instead of HTTPs and make the correct request as shown below:
Sample API request:
curl https://org-test.apigee.net:443/400-demo
or
curl https://org-test.apigee.net/400-demo
< HTTP/1.1 200 OK
< Date: Thu, 25 Feb 2021 13:01:43 GMT
< Content-Type: text/xml;charset=UTF-8
< Content-Length: 403
< Connection: keep-alive
< Server: gunicorn/19.9.0
< Access-Control-Allow-Origin: *
< Access-Control-Allow-Credentials: true
Cause: HTTP request to a TLS-configured target endpoint
This error occurs if you have incorrectly configured HTTP requests to a TLS-enabled backend server in the target endpoint of an API Proxy.
Diagnosis
Use the following steps to diagnose the error using the Trace tool:
- Enable Trace in the Apigee UI for the affected API Proxy.
- Make requests to the API Proxy.
- Select one of the API requests that failed with the
400response code. - Navigate through the various phases and determine where the failure occurred.
-
Typically you will see the
400error response coming from the backend server. That is, you will see the400error response in the phase Response received from target server as shown below: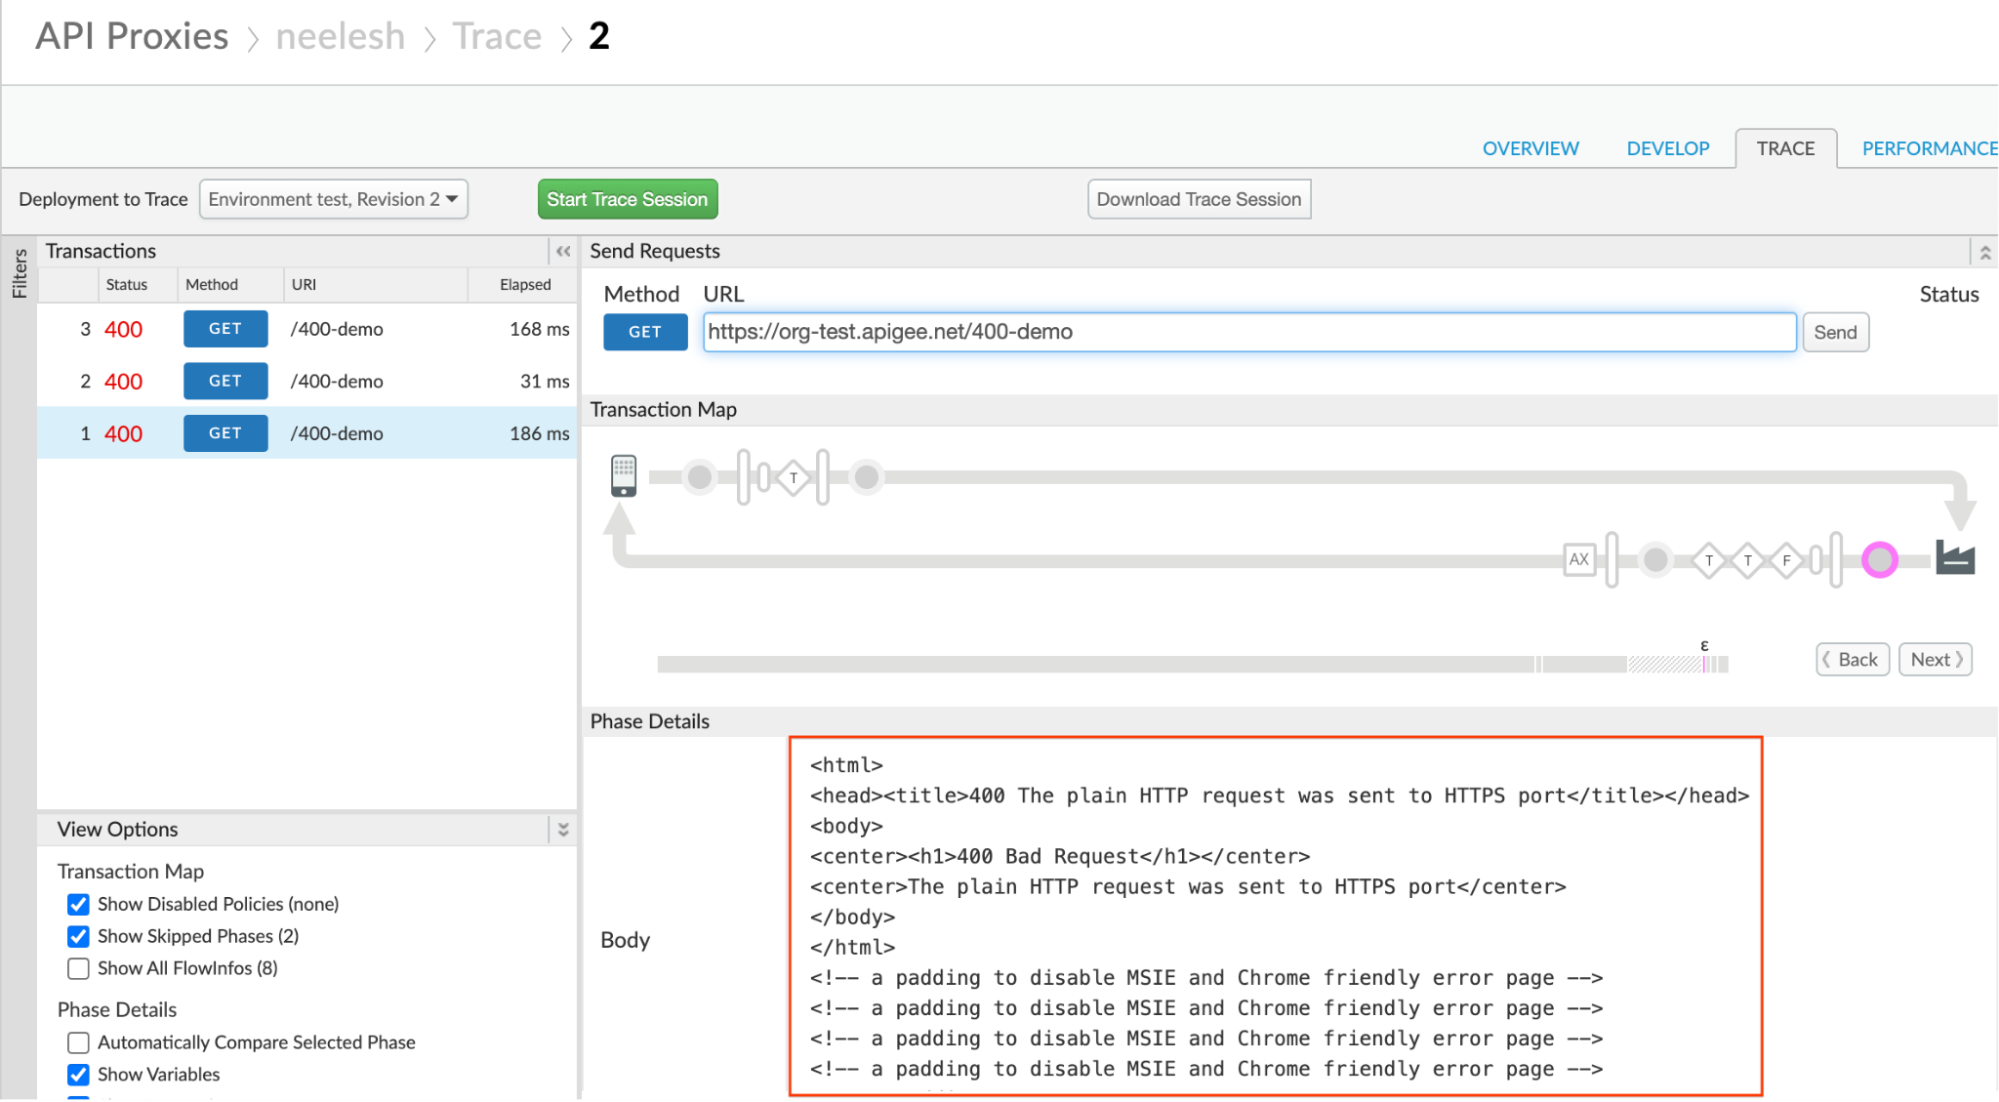
-
Determine the target endpoint for which the request was made by clicking on the AX (Analytics Data Recorded) icon in the trace.
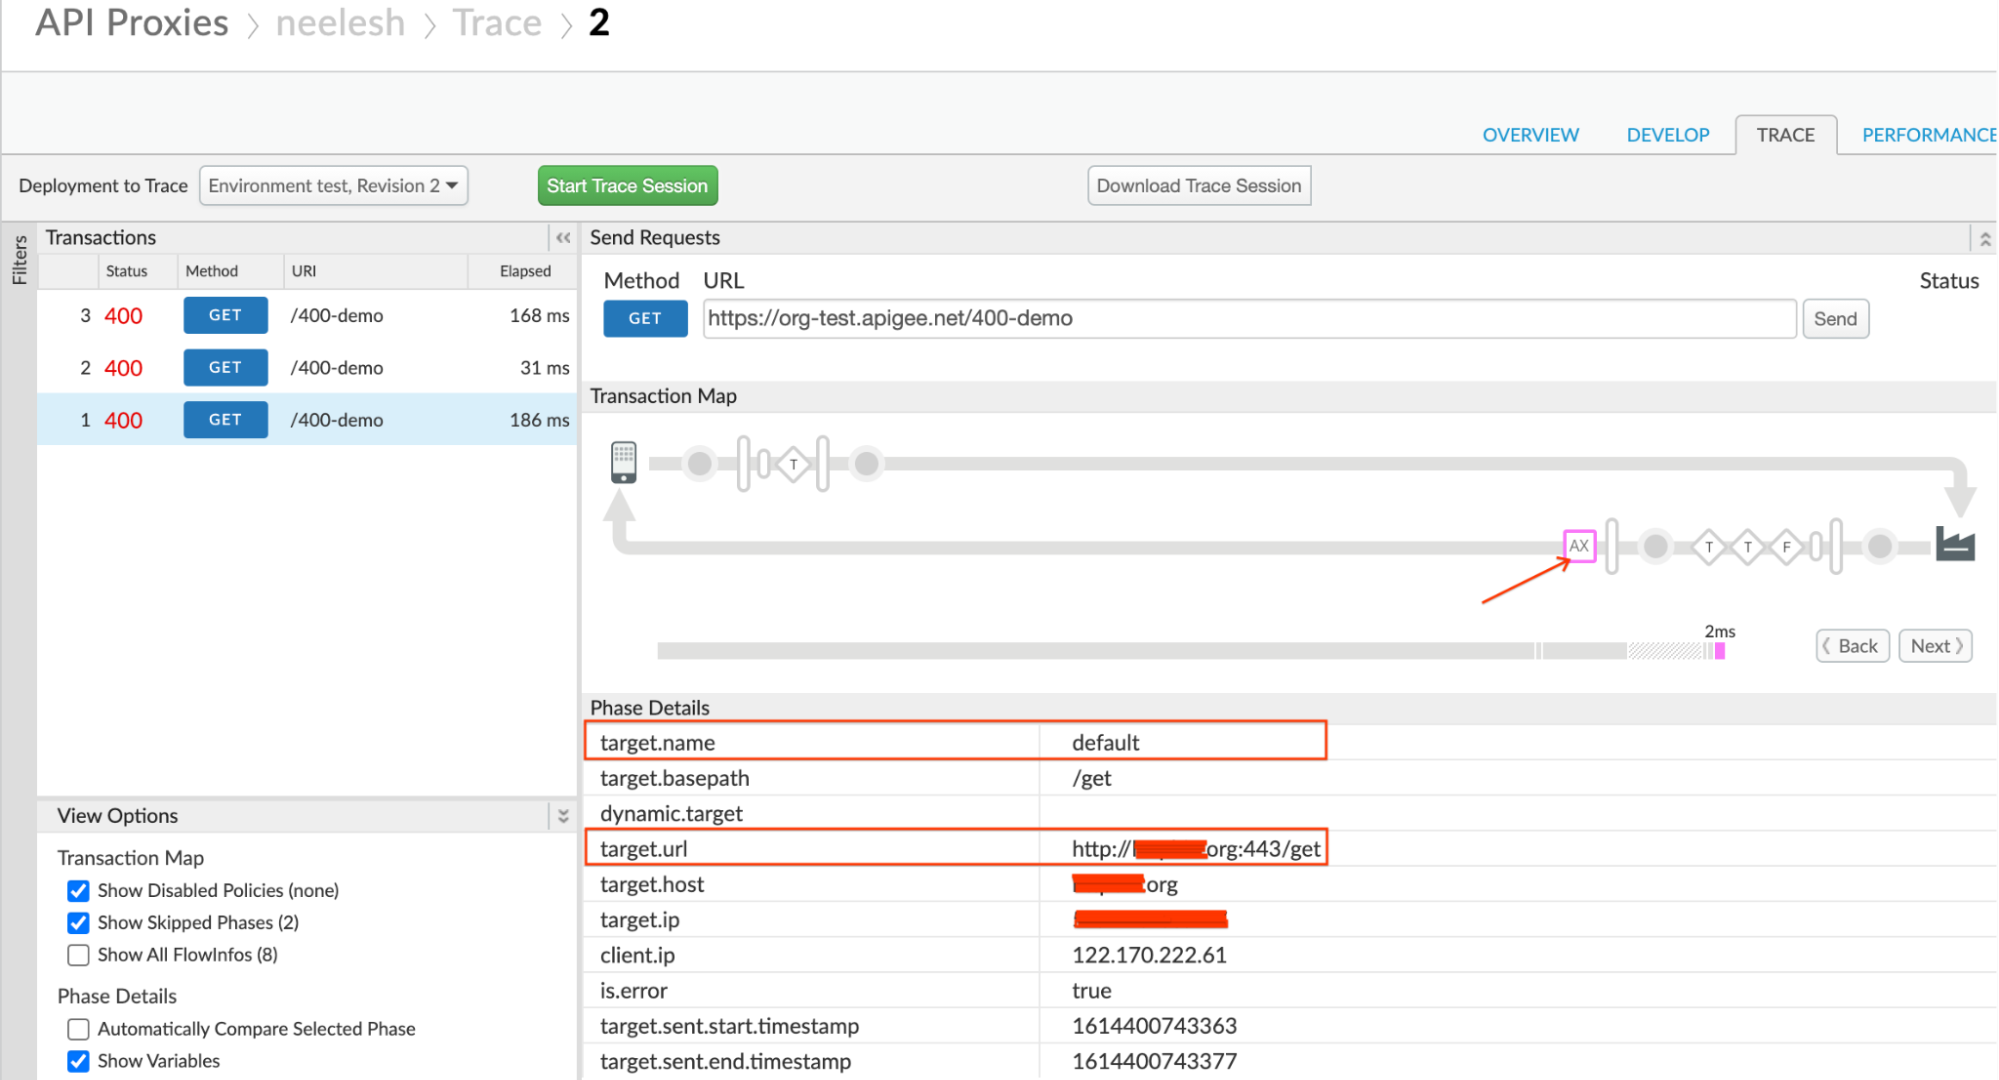
- Note the target.url, which contains the protocol, backend server host alias,
and sometimes the port number. The port used for the
target URL is
443but the protocol is HTTP. - Review the definition of the target endpoint to understand the configuration.
-
Verify that the backend server host is secure and listens on a secure port such as
443. If you are using the protocol ashttpin the<URL>element, then that’s the cause for this issue.Sample target endpoint configuration:
<?xml version="1.0" encoding="UTF-8" standalone="yes"?>
<TargetEndpoint name="default">
    <Description/>
    <FaultRules/>
    <PreFlow name="PreFlow">
        <Request/>
        <Response/>
    </PreFlow>
    <PostFlow name="PostFlow">
        <Request/>
        <Response/>
    </PostFlow>
    <Flows/>
    <HTTPTargetConnection>
        <Properties/>
        <URL>http://somehost.org:443/get</URL>
    </HTTPTargetConnection>
</TargetEndpoint>
The above example shows that you are using the HTTP protocol, but the port used is secure port
443. This causes the backend server to respond with400 Bad Requestand the error messageThe plain HTTP request was sent to HTTPS port.
Resolution
-
If your backend server is secure/TLS-enabled, then ensure that you use the protocol as
httpsin the<URL>element of the target endpoint as shown in the following example:Sample target endpoint configuration:
<HTTPTargetConnection> <Properties/> <URL>https://somehost.org:443/get</URL> </HTTPTargetConnection> -
If your backend server is non secure, then:
- Don’t mention the secure port number such as
443. - You don’t have to mention the port number at all, if your backend server listens on a standard non secure port
- Mention the port number if you are using any other non secure port, for example:
9080
Sample target endpoint configuration:
<HTTPTargetConnection> <Properties/> <URL>http://somehost.org/get</URL> </HTTPTargetConnection> or <HTTPTargetConnection> <Properties/> <URL>http://somehost.org:9080/get</URL> </HTTPTargetConnection> - Don’t mention the secure port number such as
Cause: Incorrect target server configuration
If the target server is configured with a secure port such as 443 without enabling
SSL, then it causes the Apigee Edge’s Message Processor to send HTTP requests to a secure or
TLS-configured target server leading to this issue.
Diagnosis
Use the following steps to diagnose the error using the Trace tool:
- Enable Trace in the Apigee UI for the affected API Proxy.
- Make requests to the API Proxy.
- Select one of the API requests that failed with
400response code. - Navigate through the various phases and determine where the failure occurred.
-
Typically you will see the
400error response coming from the backend server. That is you will see the400error response in the phase Response received from target server as shown below:
-
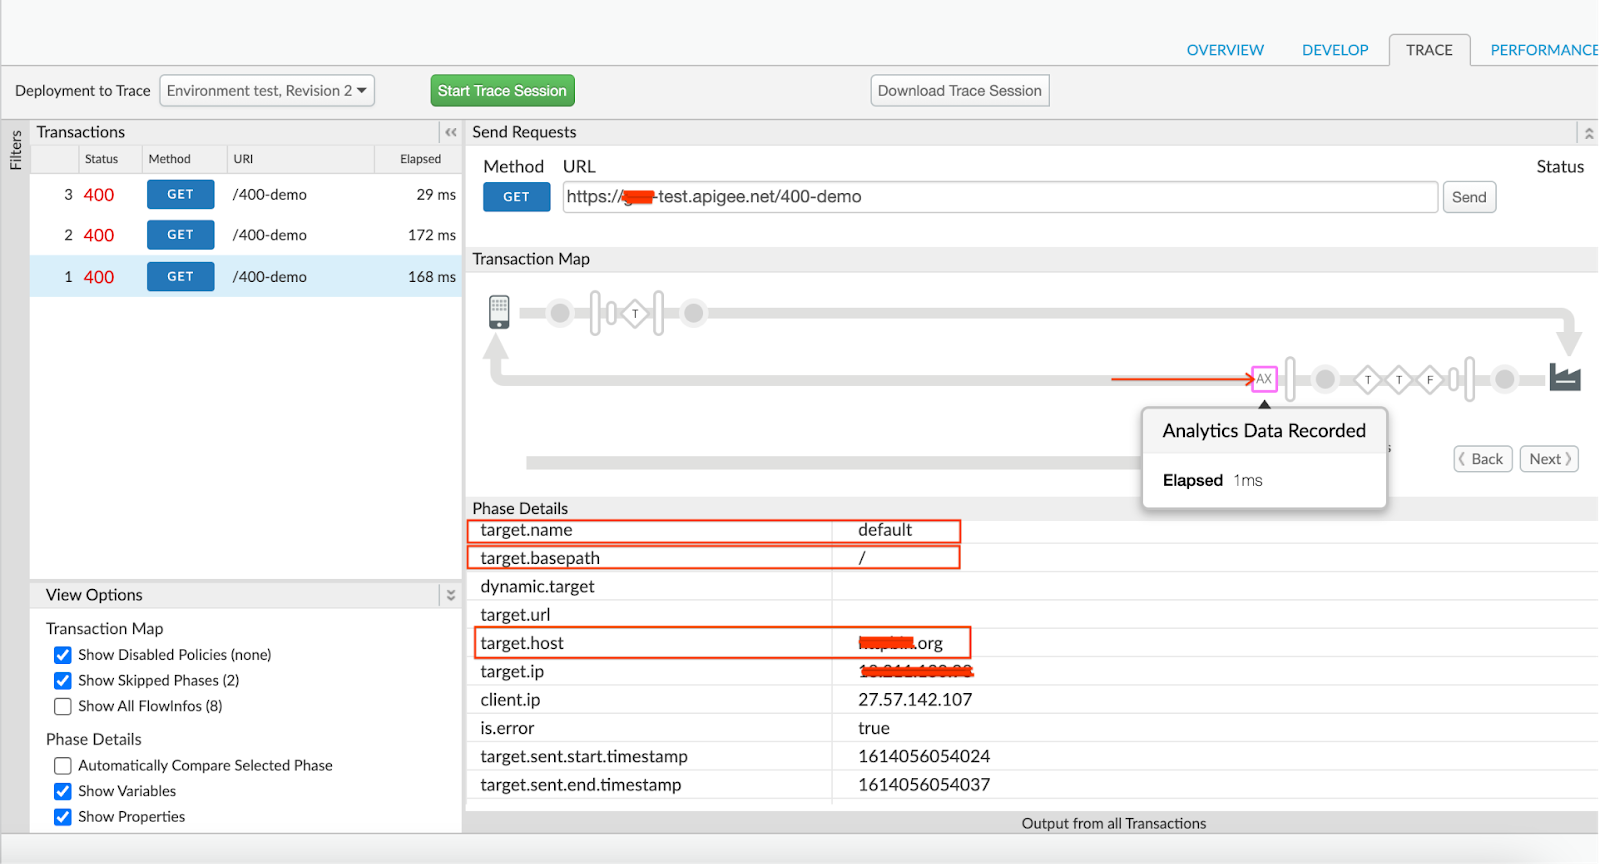
Determine the target endpoint for which the request was made by clicking on the AX (Analytics Data Recorded) icon in the trace.
-
Note the target.name, which represents the target endpoint name.
In the above example trace file, the target.name is default. This indicates that the target endpoint used for this request is default.
-
Review the definition of the target endpoint to understand the configuration.
Sample target endpoint configuration:
<?xml version="1.0" encoding="UTF-8" standalone="yes"?>
<TargetEndpoint name="default">
    <Description/>
    <FaultRules/>
    <PreFlow name="PreFlow">
        <Request/>
        <Response/>
    </PreFlow>
    <PostFlow name="PostFlow">
        <Request/>
        <Response/>
    </PostFlow>
    <Flows/>
    <HTTPTargetConnection>
        <Properties/>
        <LoadBalancer>
        <Server name="faulty-target"/>
        </LoadBalancer>
    </HTTPTargetConnection>
</TargetEndpoint>
The above sample target endpoint configuration shows that you are using a target server named
faulty-target. -
Once you have the target server name, you can use one of the following methods to check the target server configuration:
- Edge UI
- Management API
Edge UI
- Navigate to Apigee Edge > Admin > Environments > Target Servers.
- Choose the specific target server identified from the API proxy and click Edit.
- Verify the port specified for the target server and the SSL information.
-
If the target server is configured with a secure port (for example:
443), but SSL is not enabled, then that’s the cause for this issue.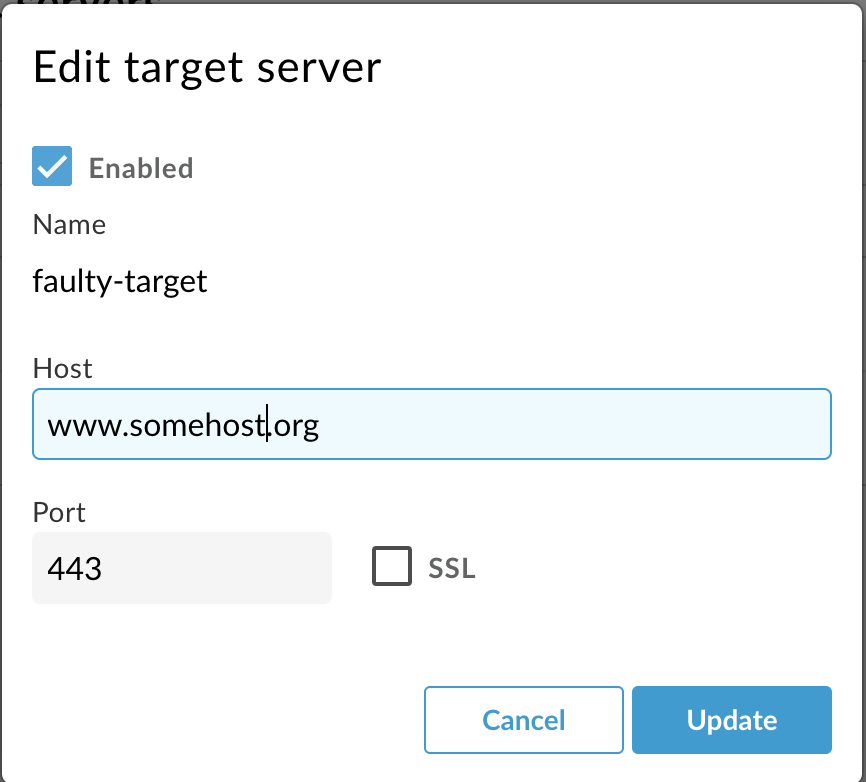
As you can see in the above screenshot, the port used is
443but SSL is not enabled for that port in the target server configuration. This causes Apigee Edge’s Message Processor to send HTTP requests to the secure port443. Therefore, you get the error400 Bad Requestwith the messageThe plain HTTP request was sent to HTTPS port.
Management API
-
Execute the Get target server API to get the details about the specific target server configuration as shown below:
Public Cloud user:
curl -v 'https://api.enterprise.apigee.com/v1/organizations/ORG_NAME/environments/ENV_NAME>/targetservers/TARGET_SERVER_NAME' \
-H "Content-Type:application/xml" \
-H "Authorization:Bearer $TOKEN"
Private Cloud user:
curl -v 'http://MANAGEMENT_IP:8080/v1/organizations/ORG_NAME/environments/ENV_NAME/targetservers/TARGET_SERVER_NAME' \
-H "Content-Type:application/xml" \
-H "Authorization:Bearer $TOKEN"
- Verify the port specified for the target server and the SSL information.
-
If the target server is configured with a secure port (for example:
443), but theSSLInfosection is not defined or is not enabled, then that’s the cause for this issue.Sample target server configuration:
{
  "host" : "somehost.org",
  "isEnabled" : true,
  "name" : "faulty-target",
  "port" : 443
}
In the above sample output, we can see that the port used for the target connection is
443, but there is noSSLInfoconfig block.This causes Apigee Edge’s Message Processor to send HTTP requests to the secure port
443. Therefore, you get the error400 Bad Requestwith the messageThe plain HTTP request was sent to HTTPS port.
Resolution
If your target server is secure or TLS-configured, then you need to enable SSL for the specific target server.
You can do this by using one of the following options:
- Edge UI
- Management API
Edge UI
- Navigate to the target server on Edge UI > Admin > Environments > Target Servers.
- Choose the specific target server and click Edit.
- If your target server is secure and uses a port such as
443, enable SSL by selecting the check box next to the SSL option. - Configure Truststore, Ciphers, and Protocols. (Only if required)
Management API
Use the management API to configure the target server as described in the Update target server configuration documentation.
Must gather diagnostic information
If the problem persists even after following the above instructions, gather the following diagnostic information and then contact Apigee Edge Support.
- If you are a Public Cloud user, provide the following information:
- Organization name
- Environment name
- API proxy name
- Complete curl command to reproduce the error
- Trace tool output (if you have been able to capture for the failing request)
- If you are a Private Cloud user, provide the following information:
- Complete error message observed
- Environment name
- API proxy bundle
- Target server definition (if you are using target server in your endpoint)
- Trace tool output (if you have been able to capture for the failing request)
