
You're viewing Apigee Edge documentation.
Go to the
Apigee X documentation. info
Symptom
The client application receives a 502 Bad Gateway error. The Message Processor returns this error to the client application when it does not receive a response from a backend server.
Error message
The client application receives the following response code:
HTTP/1.1 502 Bad Gateway
In addition, you may observe the following error message:
{
 "fault": {
    "faultstring":"Bad Gateway",
    "detail":{
        "errorcode":"messaging.adaptors.http.flow.BadGateway"
    }
 }
}
Possible Cause
The possible cause for this issue is listed in the following table:
| Cause | Description | Troubleshooting steps can be performed by |
| TLS/SSL handshake timeout | A timeout occurs during the TLS/SSL Handshake between the Message Processor and backend server. | Edge Private and Public Cloud users |
Cause: TLS/SSL handshake timeout
In Apigee Edge, you can set up a TLS/SSL connection to the backend server to enable TLS communication between the Edge Message Processor and a backend server.
A TLS/SSL handshake involves multiple steps. This error typically happens when the TLS/SSL handshake between the Message Processor and a backend server times out.
Diagnosis
This section explains how to correctly diagnose a TLS/SSL handshake timeout. Instructions for Edge Private Cloud and Public Cloud are listed.
Investigate Trace session output
The following steps explain how to do a preliminary diagnosis of the problem using the Apigee Edge Trace tool.
- In the Edge UI, enable a Trace session for the affected API proxy.
If the trace for the failing API request shows the following, it is likely that a TLS/SSL handshake timeout error occurred. The probable cause of the error is that the backend server firewall is blocking traffic from Apigee.
- Determine if the 502 Bad Gateway error occurs after 55 seconds, which is the default timeout period set on the Message Processor. If you see that the error occurred after 55 seconds, this tells you that a timeout was the likely cause of the problem.
- Determine if the error shows the fault: messaging.adaptors.http.BadGateway. Again, this error usually indicates a timeout occurred.
If you are on Edge Private Cloud, note the value of the X-Apigee.Message-ID field in the trace output as shown below. A Private Cloud user can use this ID value to do further troubleshooting, as explained later.
Click the Analytics Data Recorded icon in the trace path:
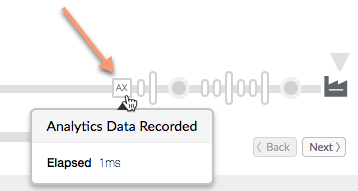
Scroll down and note the value of the field called X-Apigee.Message-ID.
To confirm that TLS/SSL Handshake timeout was the cause of the error, follow the steps in the following sections depending on whether you are on Public Cloud or Private Cloud.
Additional diagnostic steps for Edge Private Cloud users only
If you are on Apigee Edge Private Cloud, you can perform the following steps to help verify the cause of the handshake error. In this step, you inspect the Message Processor log file for relevant information. If you are on Edge Public Cloud you can skip this section and go to Further Diagnostic Steps for Private and Public Cloud Users.
Check if you can connect to the specific backend server directly from each of the Message Processors using the
telnetcommand:If the backend server resolves to a single IP address, then use this command:
telnet BackendServer-IPaddress 443
If the backend server resolves to multiple IP addresses, then use the hostname of the backend server in the telnet command as shown below:
telnet BackendServer-HostName 443
If you are able to connect to the backend server without any errors, go on to the next step.
If the
telnetcommand fails, you need to work with your network team to check the connectivity between the message processor and the backend server.Check the Message Processor log file for evidence of a handshake failure. Open the file:
/opt/apigee/var/log/edge-message-processor/system.logand search for the unique message ID (the value of X-Apigee.Message-ID that you found in the trace file). Determine if you see a handshake error message associated with the message ID as shown below:
org:xxx env:xxx api:xxx rev:x messageid:<MESSAGE_ID> NIOThread@1 ERROR HTTP.CLIENT -
HTTPClient$Context.handshakeTimeout() : SSLClientChannel[Connected: Remote:X.X.X.X:443
Local:X.X.X.X]@739028 useCount=1 bytesRead=0 bytesWritten=0 age=55221ms lastIO=55221ms
isOpen=true handshake timeout
If you see this error in the message processor's log file, continue further investigation. Go to Further diagnostic steps for Edge Private and Public Cloud users.
If you do not see the handshake message in the log file, go to Must Gather Diagnostic Information
Further diagnostic steps for Edge Private and Public Cloud users
To further pinpoint the problem, you can use the tcpdump tool to analyze TCP/IP packets to confirm if a timeout occurred during the TLS/SSL handshake.
- If you are a Private Cloud user, you can capture the TCP/IP packets on the backend server or Message Processor. Preferably, capture them on the backend server, because the packets are decrypted on the backend server.
- If you are a Public Cloud user, you do not have access to the Message Processor; however, capturing the TCP/IP packets on the backend server may help pinpoint a problem.
After deciding where to capture the TCP/IP packets, use the following tcpdump command to capture TCP/IP packets.
tcpdump -i any -s 0 host <IP address> -w <File name>If you are taking the TCP/IP packets on the backend server, then use the public IP address of the Message Processor in the
tcpdumpcommand. For help using the command to examine backend server traffic, see tcpdump.If you are taking the TCP/IP packets on the Message Processor, then use the public IP address of the backend server in the
tcpdumpcommand. For help using the command to examine Message Processor traffic, see tcpdump.If there are multiple IP addresses for backend server/Message Processor, then you need to try another
tcpdumpcommand usage. Refer to tcpdump for more information about this tool and for other variants of this command.
Analyze the TCP/IP packets using the Wireshark tool or a similar tool. The following screenshot shows TCP/IP packets in Wireshark.
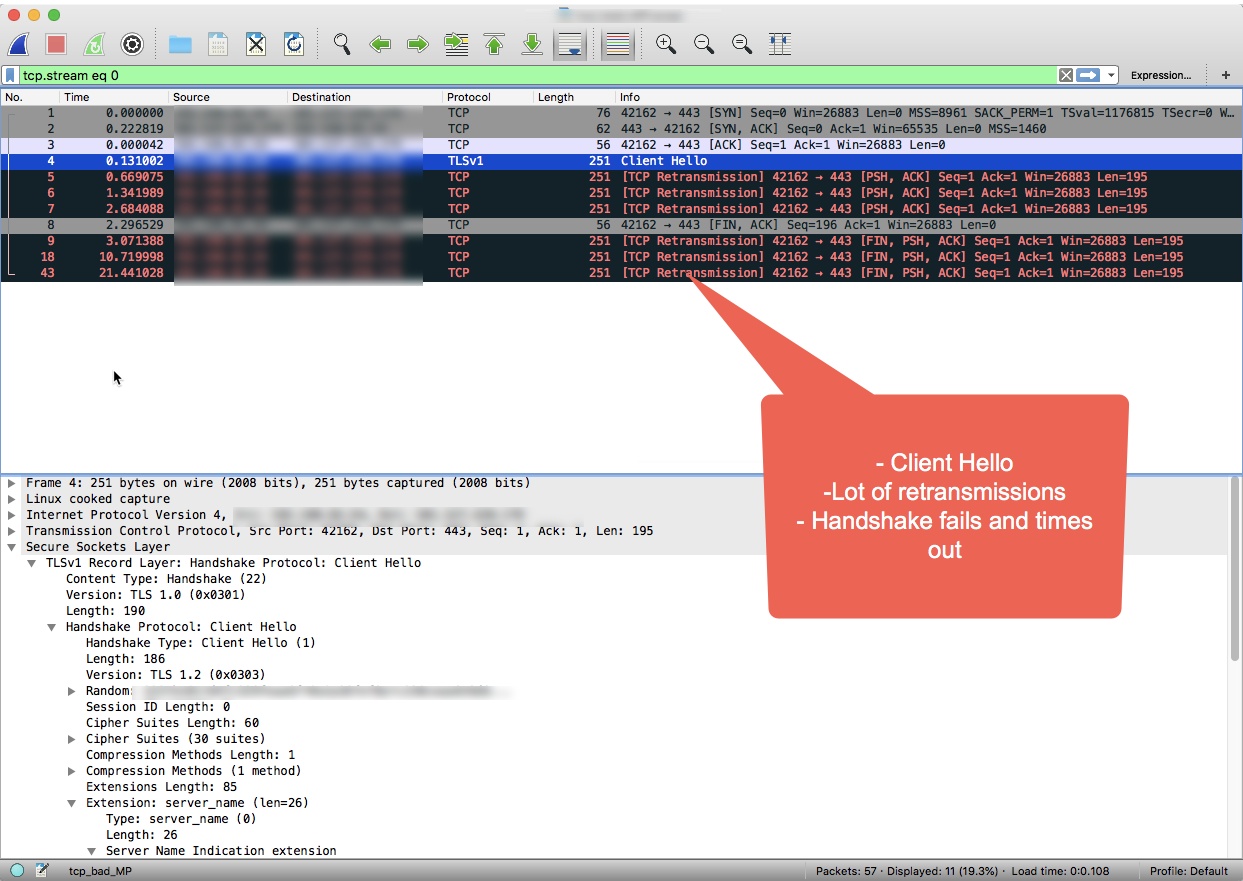
Notice in the Wireshark output, that the three-way TCP handshake completes successfully in the first 3 packets.
The Message Processor then sends the "Client Hello" message in packet #4.
Because there is no acknowledgement from the backend server, the Message Processor retransmits the "Client Hello" message multiple times in packets 5, 6 and 7 after waiting for a predefined interval of time.
When the Message Processor doesn't receive any acknowledgement after 3 retries, it sends the FIN, ACK message to backend server to indicate that it is closing the connection.
As you shown in the example Wireshark session, the connection to the backend is successful (step #1), however, the SSL handshake timed out because the backend server never responded.
If you performed the troubleshooting steps in this playbook and determined that a timeout caused the TLS/SSL handshake error, go to the Resolution section.
Using API Monitoring to identify a problem
API Monitoring enables you to isolate problem areas quickly to diagnose error, performance, and latency issues and their source, such as developer apps, API proxies, backend targets, or the API platform.
Step through a sample scenario that demonstrates how to troubleshoot 5xx issues with your APIs using API Monitoring. For example, you may want to set up an alert to be notified when the number of messaging.adaptors.http.BadGateway faults exceeds a particular threshold.
Resolution
Typically the SSL handshake timeouts occur because of firewall restrictions on the backend server that blocks the traffic from Apigee Edge. If you followed the diagnostic steps and determined that the cause of the handshake error is a timeout, you need to engage your network team to identify the cause and fix the firewall restrictions.
Note that the firewall restrictions could be imposed at different network layers. It's important to make sure that the restrictions at all network layers are removed pertaining to the Message Processor IPs to ensure smooth traffic flow between Apigee Edge and the backend server.
If there are no firewall restrictions and/or the problem still persists, go to Must Gather Diagnostic Information.
Must Gather Diagnostic Information
If the problem persists even after following the above instructions, please gather the following diagnostic information. Contact and share them to Apigee Edge Support:
- If you are a Public Cloud user, then provide the following information:
- Organization Name
- Environment Name
- API Proxy Name
- Complete curl command to reproduce the error
- Trace File showing the error
- TCP/IP packets captured on the backend server
- If you are a Private Cloud user, provide the following information:
- Complete Error Message observed
- API Proxy bundle
- Trace File showing the error
- Message Processor logs /opt/apigee/var/log/edge-message-processor/logs/system.log
- TCP/IP packets captured on the backend server or Message Processor.
- Details about what sections in this Playbook you have tried and any other insights that will help us to fastrack resolution of this issue.