
You're viewing Apigee Edge documentation.
Go to the
Apigee X documentation. info
Symptom
The client application receives an HTTP status code of 504 with the message "Gateway Timeout" in response to API calls.
This error response indicates that the client did not receive a timely response from Apigee Edge or the backend server during the execution of an API call.
Error Message
The client application receives the following response code:
HTTP/1.1 504 Gateway Timeout
This code may be followed by an error message similar to the one below:
<html>
<head><title>504 Gateway Timeout</title></head>
<body bgcolor="white">
<center><h1>504 Gateway Timeout</h1></center>
</body>
</html>
What causes gateway timeouts?
The typical path for an API request made via Apigee Edge is Client -> Router -> Message Processor -> Backend Server as shown in the figure below:
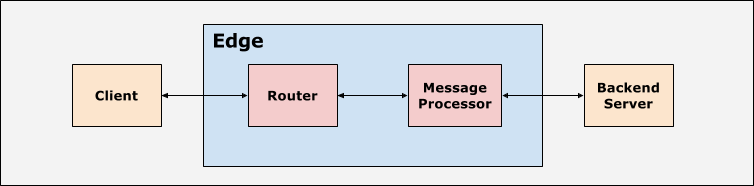
The client application, routers, and Message Processors are configured with suitable timeout values. Apigee Edge expects a response for every API request within a time period based on the timeout values. If the response is not received within the specified time period, then a 504 Gateway Timeout response is returned.
Possible Causes
In Apigee Edge, the typical cause of a 504 Gateway Timeout response from the backend server is:
| Cause | Description | Troubleshooting Instructions For |
|---|---|---|
| Backend Server responding with 504 Gateway Timeout | The backend server times out and returns a 504 Gateway Timeout response to the Message Processor. | Edge Private and Public Cloud Users |
Backend Server responding with 504 Gateway Timeout
The backend server may respond with an HTTP response code of 504 Gateway Timeout.
Diagnosis
This section explains how to correctly diagnose a 504 Gateway Timeout. Procedures for both Private and Public Cloud users are listed.
Procedure #1: Using Trace (Private and Public Cloud users)
- Enable Trace in the Apigee UI for the affected API.
- Send a request to the backend server.
- If the failing API request shows a 504 response from the backend server in Trace, then the cause of the 504 Gateway Timeout is the backend server.
- To determine the response time, click on the Response received from target server
phase in Trace. In the example shown, the elapsed time is 60004 ms:
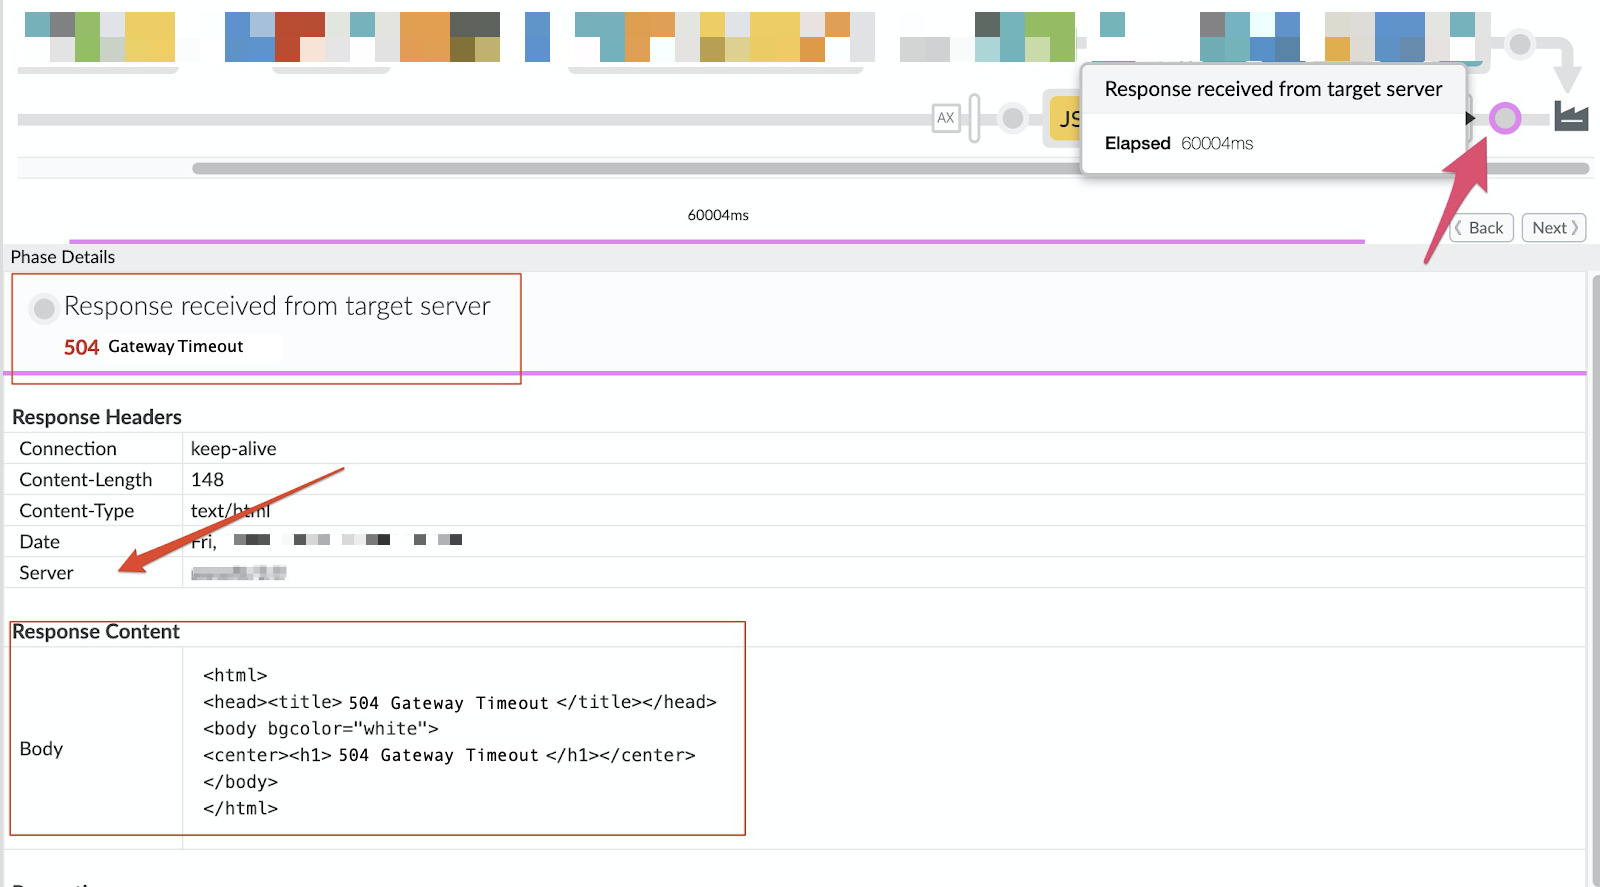
The Phase Details section provides additional information:
- It highlights the 504 Gateway Timeout response received from the backend server.
- The Response Content section displays the full body of the response from the backend server. As noted earlier, the format and the content of the response payload may differ based on the backend server implementation.
- The Response Header > Server section may indicate where the response originated.
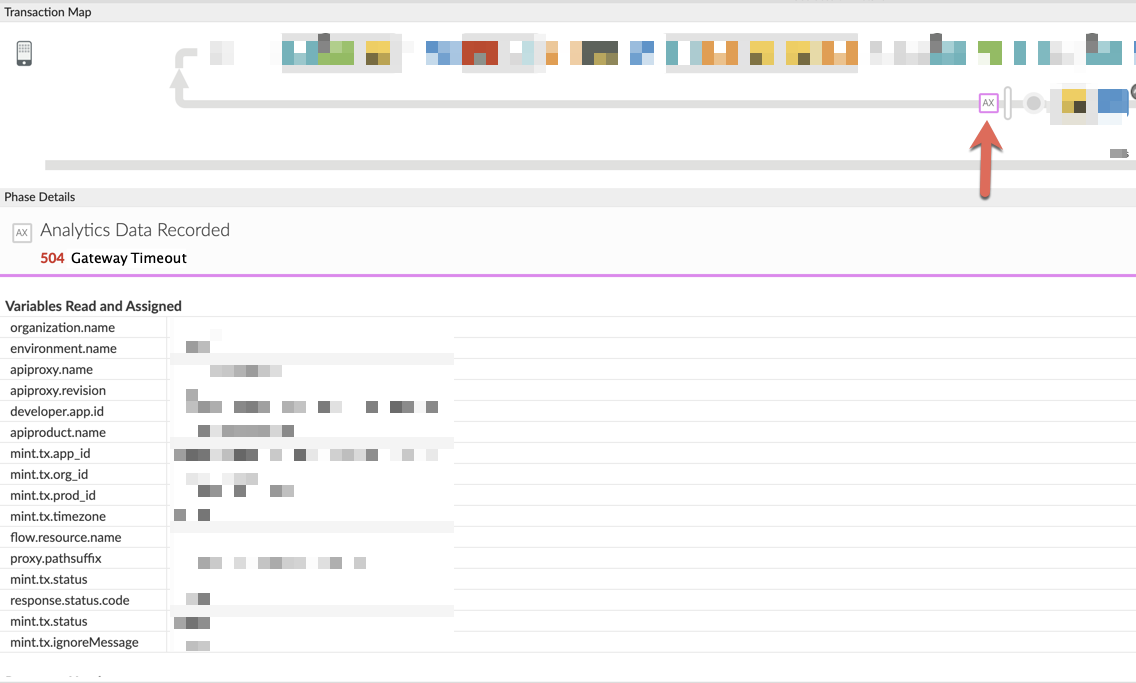
- To view Analytics data and confirm the diagnosis, click on the Analytics Data Recorded
phase in Trace, as shown in the figure below:
The Response Headers section of the Phase Details displays the values of
X-Apigee-fault-codeandX-Apigee-fault-source, as shown in the figure below: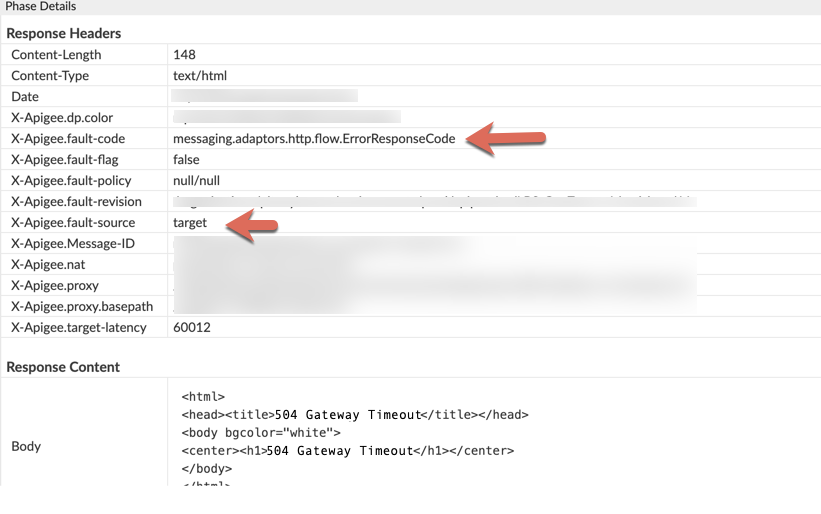
If these fields contain the values shown in the table below, the 504 error response originates from the backend server:
Response Headers Value X-Apigee-fault-source target X-Apigee-fault-code messaging.adaptors.http.flow.ErrorResponseCode -
Check for
proxy chaining. Follow these steps to determine if the backend server is invoking another proxy
in Apigee:
- Navigate back to the Request sent to target server phase and click the Show Curl button to view the backend server host alias.
- If the backend server host alias points to a virtual host alias, then proxy chaining is in place. Repeat the steps above for each chained proxy to diagnose the cause of the 504 Gateway Timeout error response. 504 Gateway timeouts occurring in chained proxies at other stages of the request/response cycle can be diagnosed using this playbook.
- If the backend server host alias points to the backend server, proceed to Resolution.
Procedure #2: Invoke the backend server API directly (Public and Private Cloud users)
Call the backend server directly to confirm the same 504 Gateway Timeout response behavior encountered when the request is made through Apigee Edge.
- Ensure that you have all the required headers, query parameters, and credentials needed to pass to the backend server as part of the request.
- If the backend service is publicly accessible, then you can use the
curlcommand, Postman, or any other REST Client and invoke the backend server API directly. - If the backend server is accessible only from the Message Processors, use the
curlcommand, Postman, or any other REST Client toinvoke the backend server API directly from the Message Processor. - If the backend service returns a 504 Gateway Timeout response, proceed to Resolution.
Procedure #3: Check NGINX Access Logs (Private Cloud users only)
NGINX access logs can help determine whether the 504 error response was sent by the backend server. This is particularly useful if the issue occurred in the past, is intermittent, or cannot be captured in Trace. Use these steps to check the NGINX access logs:
- View the NGINX access logs using this command:
/opt/apigee/var/log/edge-router/nginx/ ORG ~ENV.PORT# _access_log
- Check for 504 error responses for the affected API proxy. You can check a specific time period, if the issue occurred in the past, or determine if requests are still failing with a 504 error response.
- If there are any 504 error responses, determine whether the error response originates from the backend server.
- Review the affected API proxy to check for proxy chaining i.e., the backend server/target endpoint is invoking another proxy in Apigee. If the API proxy is using proxy chaining , repeat the steps above for each chained proxy to diagnose the cause of the 504 Gateway Timeout error response. 504 Gateway timeouts occurring in chained proxies at other stages can be diagnosed using this playbook.
- If there is no proxy chaining, and the 504 error response originates from the backend server, proceed to Resolution.
The figure below is an example of an NGINX log entry showing a 504 error response caused by the target server:
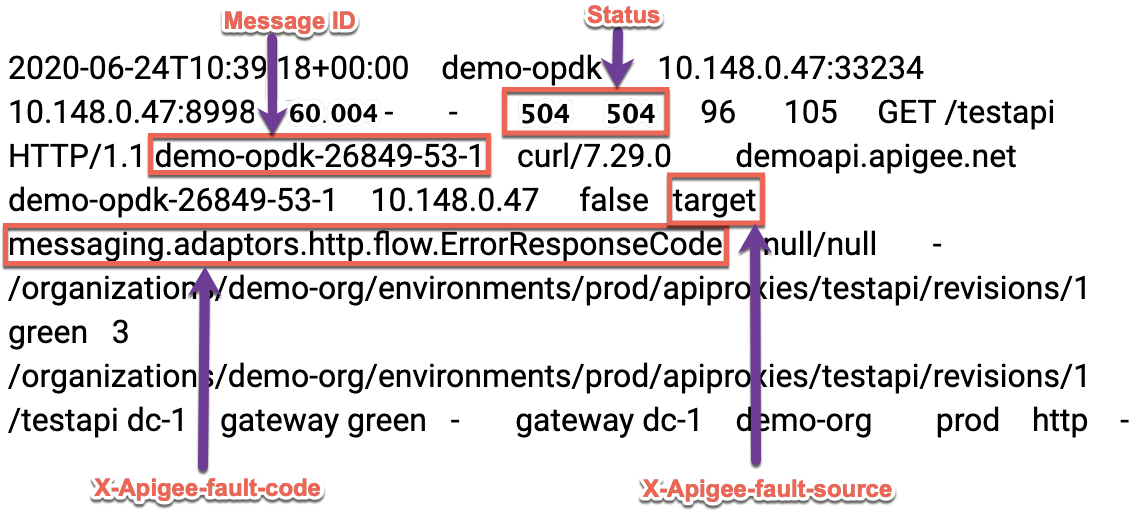
If the X-Apigee-fault-source and X-Apigee-fault-code fields contain the
values shown in the table below, the 504 response originates from the backend server:
| Response Headers | Value |
|---|---|
| X-Apigee-fault-source | target |
| X-Apigee-fault-code | messaging.adaptors.http.flow.ErrorResponseCode |
Procedure #4: Using API Monitoring (Public Cloud users only)
API Monitoring enables you to isolate problem areas quickly to diagnose error, performance, and latency issues and their source, such as developer apps, API proxies, backend targets, or the API platform.
Step through a sample scenario that demonstrates how to troubleshoot 5xx issues with your APIs using API Monitoring. For example, set up an alert to notify administrators when the number of 504 status codes exceeds a particular threshold.
Resolution
Using the diagnostic procedures outlined above, you can work with the backend server team to fix the issue in the backend server. This may include adjusting timeouts in the backend servers or timeouts in any load balancers in front of target servers.
Gather Diagnostic Information
If the issue persists, share the following diagnostic information with Apigee Support.
If you are a Public Cloud user, provide the following information:
- Organization Name
- Environment Name
- API Proxy Name
- Complete
curlcommand used to reproduce the 504 error response - Trace file with API requests receiving a 504 Gateway Timeout error response
If you are a Private Cloud user, provide the following information:
- Complete error message observed for the failing requests
- Environment Name
- API Proxy Bundle
- Trace file with API requests receiving a 504 Gateway Timeout error response
- NGINX access logs
/opt/apigee/var/log/edge-router/nginx/ ORG ~ENV.PORT# _access_log
- Message Processor logs
/opt/apigee/var/log/edge-message-processor/logs/system.log