
You're viewing Apigee Edge documentation.
Go to the
Apigee X documentation. info
Symptom
The client application receives a timeout error for API requests or the request is terminated abruptly while the API request is still being executed on Apigee.
You will observe the status code 499 for such API requests in API Monitoring, and
NGINX Access logs. Sometimes, you will see different status codes in API Analytics because it
shows the status code returned by the Message Processor.
Error message
Client applications may see errors such as:
curl: (28) Operation timed out after 6001 milliseconds with 0 out of -1 bytes received
What causes client timeouts?
The typical path for an API request on the Edge platform is Client > Router > Message Processor > Backend Server as shown in the following figure:
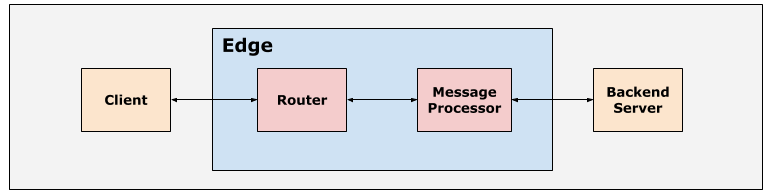
The Routers and Message Processors within the Apigee Edge platform are set up with suitable default timeout values in order to ensure that the API requests don’t take too long to complete.
Timeout on Client
Client applications can be configured with a suitable timeout value based on your needs.
Clients such as web browsers and mobile apps have timeouts defined by the operating system.
Timeout on Router
The default timeout configured on Routers is 57 seconds. This is the maximum amount of time an API proxy can execute from the time the API request is received on Edge until the response is sent back, including the backend response and all policies that are executed. The default timeout can be overridden on the Routers and virtual hosts as explained in Configuring I/O timeout on Routers.
Timeout on Message Processors
The default timeout configured on Message Processors is 55 seconds. This is the maximum amount of time that the backend server can take to process the request and respond back to the Message Processor. The default timeout can be overridden on the Message Processors or within API Proxy as explained in Configuring I/O timeout on Message Processors.
If the client closes the connection with the Router before the API proxy timed out, then you
will observe the timeout error for the specific API request. The status code 499 Client
Closed Connection is logged in the Router for such requests, which can be observed in API
Monitoring and NGINX Access logs.
Possible Causes
In Edge, the typical causes for the 499 Client Closed Connection error are:
| Cause | Description | Troubleshooting instructions applicable for |
|---|---|---|
| Client abruptly closed the connection | This happens when the client closes the connection due to the end user cancelling the request before it is completed. | Public and Private Cloud users |
| Client application timeout | This happens when the client application times out before the API Proxy has time to process and send the response. Typically this happens when the client timeout is less than the router timeout. | Public and Private Cloud users |
Common diagnosis steps
Use one of the following tools/techniques to diagnose this error:
- API Monitoring
- NGINX access logs
API Monitoring
To diagnose the error using API Monitoring:
- Navigate to the Analyze > API Monitoring > Investigate page.
- Filter for
4xxerrors and select the timeframe. - Plot Status Code against Time.
- Select a cell which has
499errors as shown below: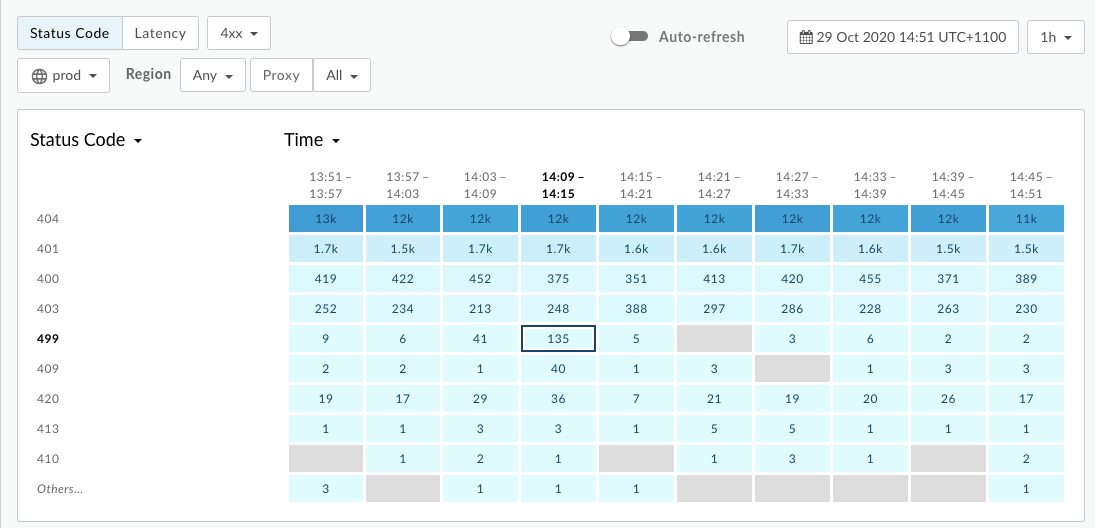
- You will see the information about the
499error on the right hand pane as shown below: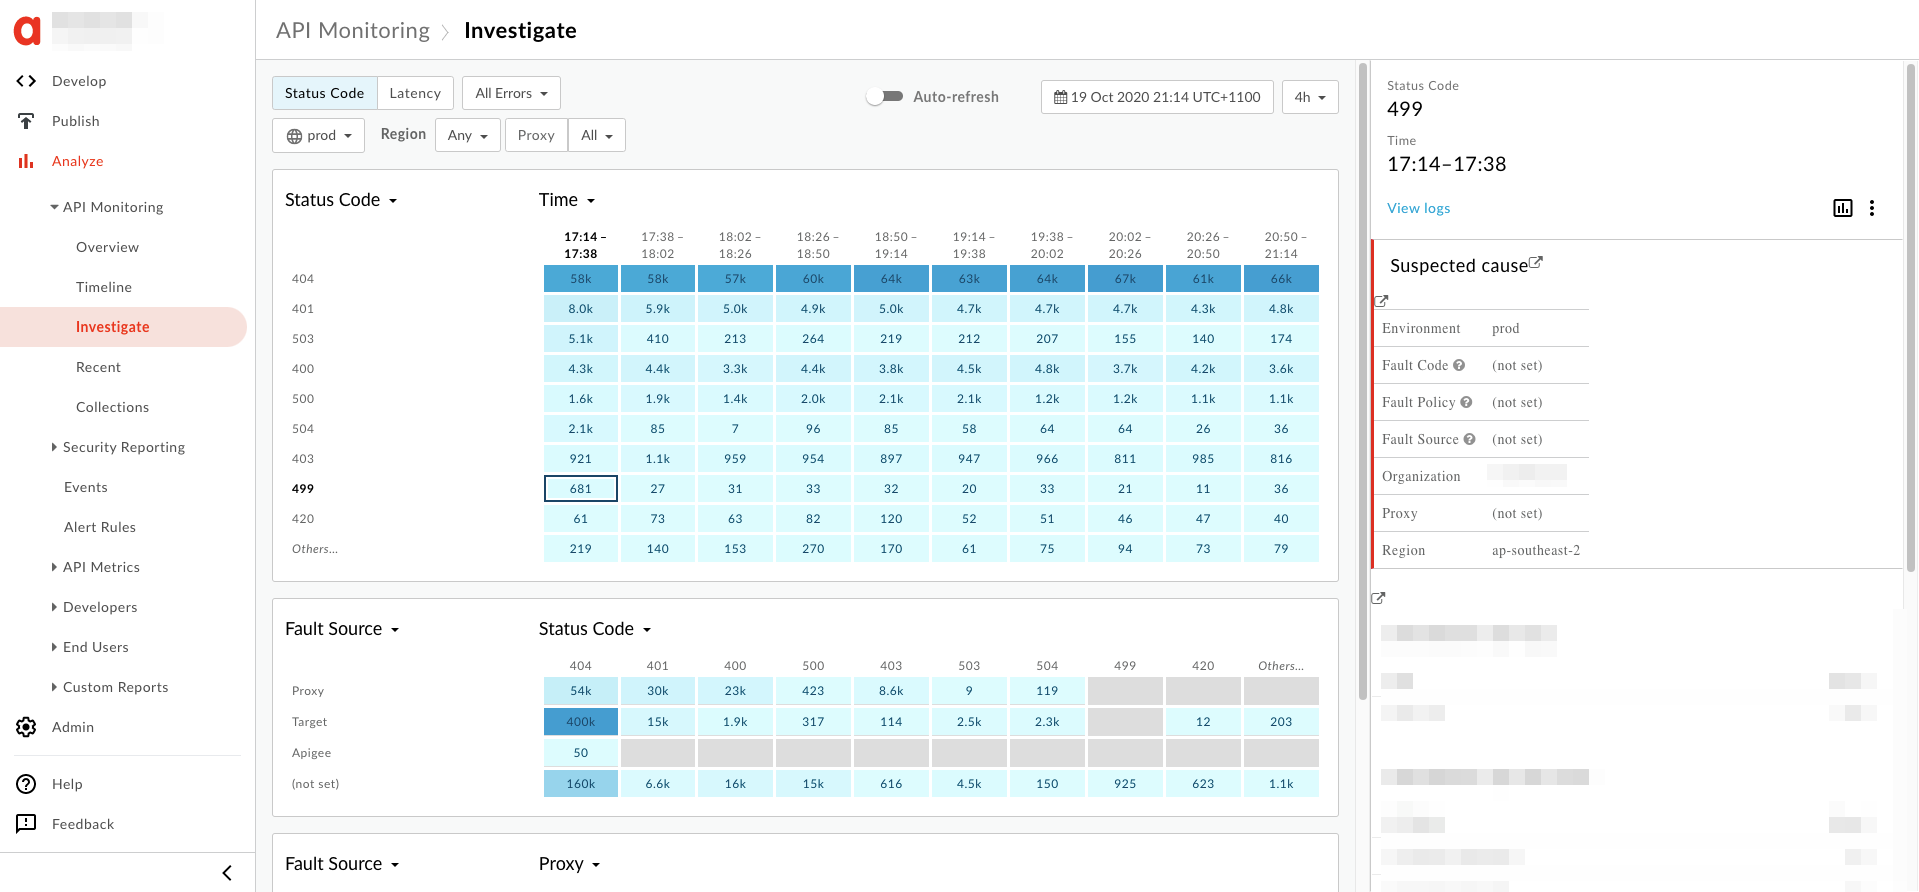
- In the right hand pane, click View logs.
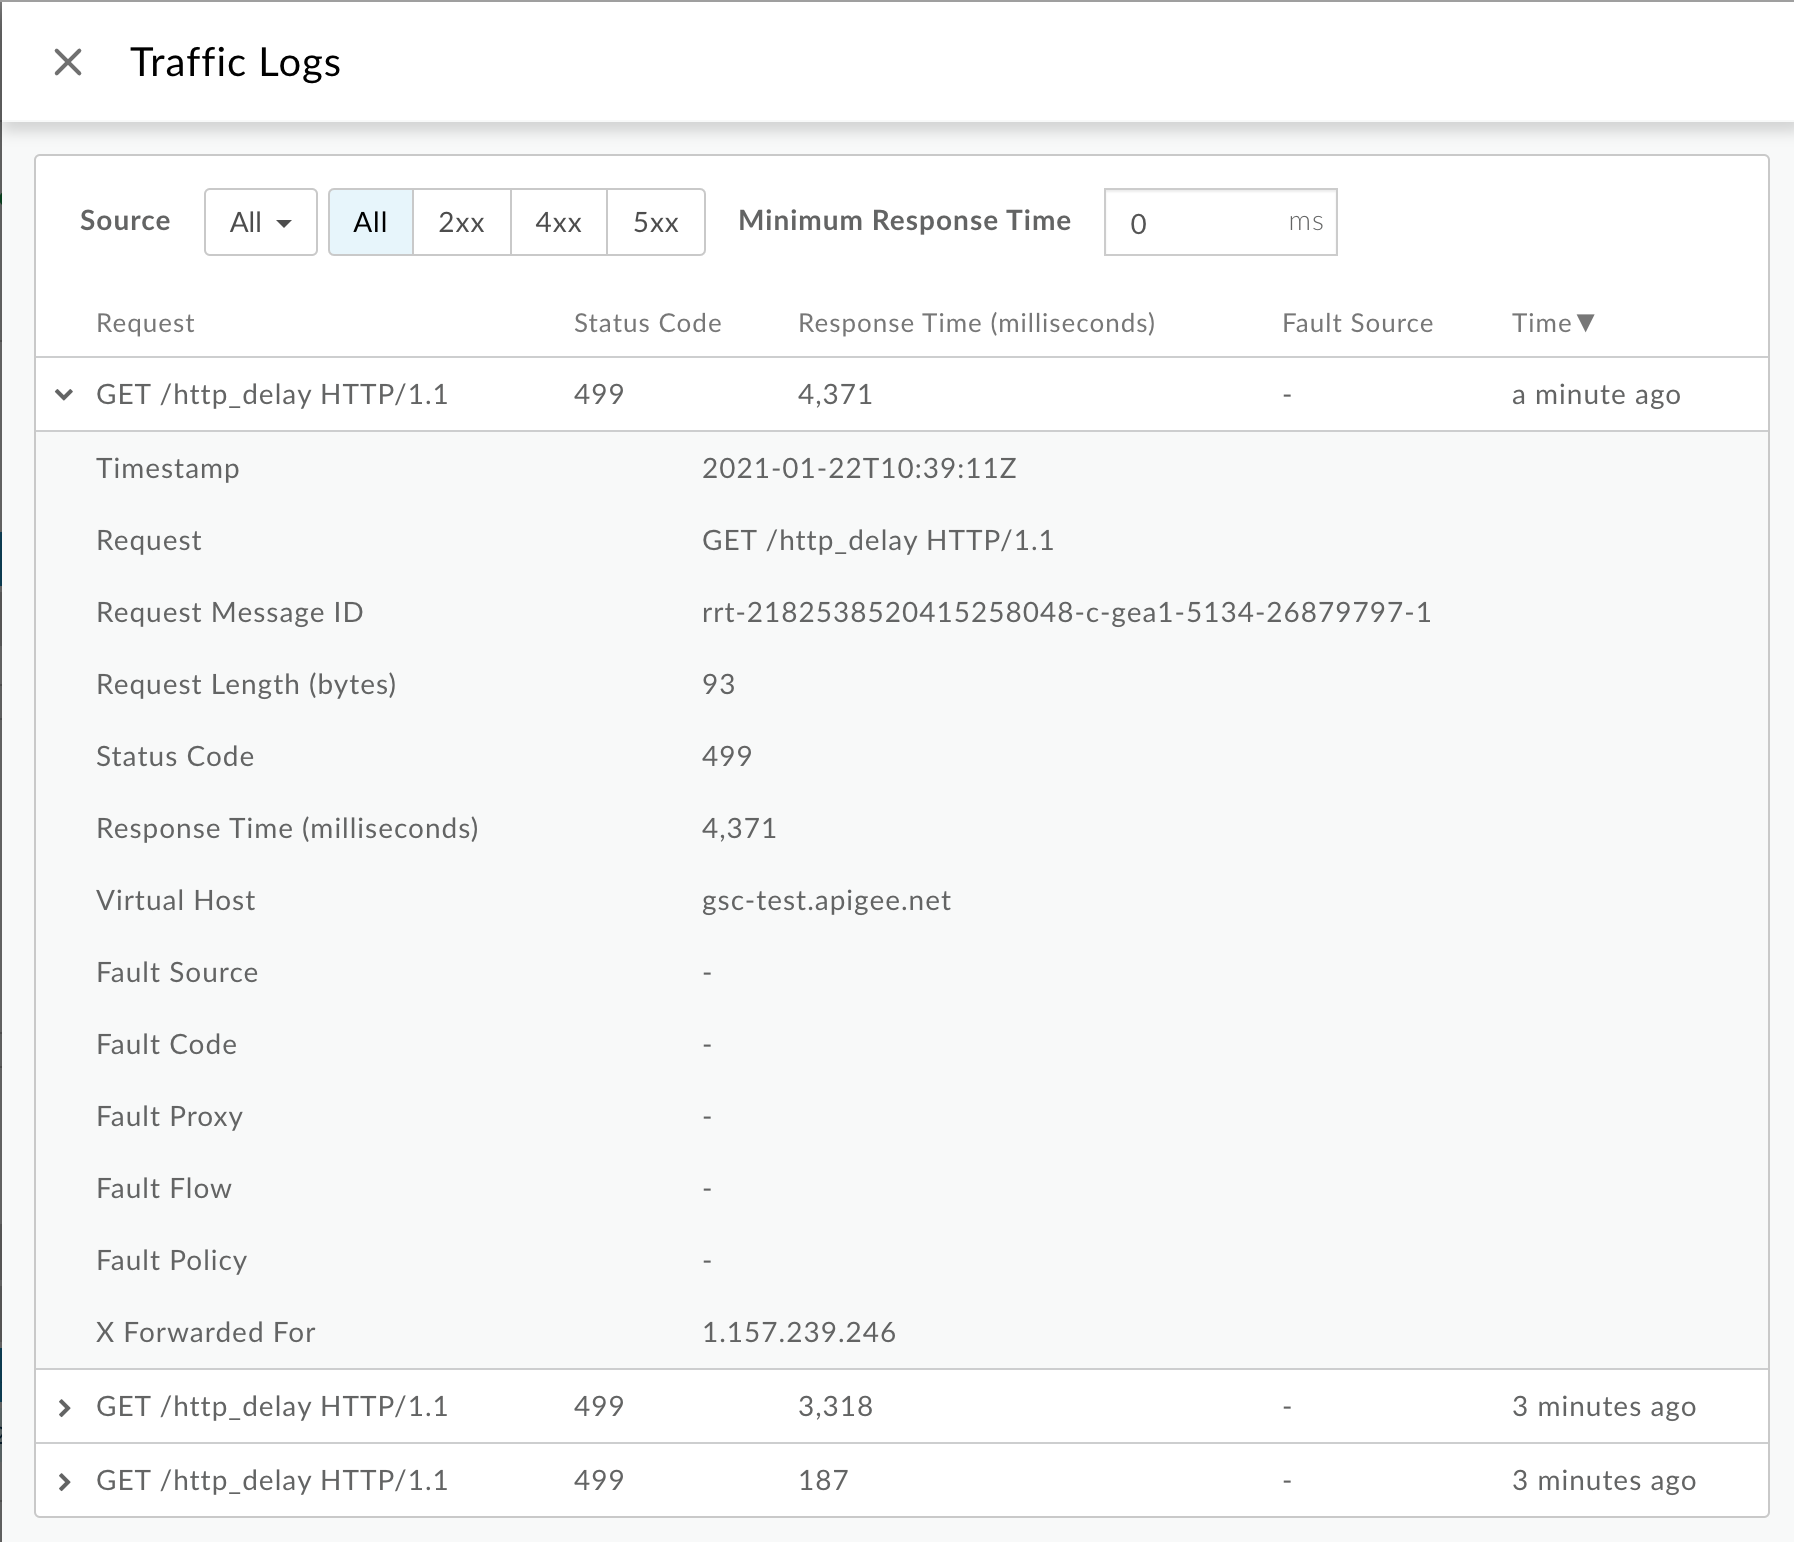
From the Traffic Logs window, note the following details for some
499errors:- Request:This provides the request method and URI used for making the calls
- Response Time:This provides the total time elapsed for the request.
You can also get all of the logs by using the API Monitoring GET logs API. For example, by querying logs for
org,env,timeRange, andstatus, you would be able to download all the logs for transactions where the client timed out.Since API Monitoring sets the proxy to
-for HTTP499errors, you can use the API (Logs API) to get the associated proxy for the virtual host and path.For example :
curl "https://apimonitoring.enterprise.apigee.com/logs/apiproxies?org=ORG&env=ENV&select=https://VIRTUAL_HOST/BASEBATH" -H "Authorization: Bearer $TOKEN"
- Review the Response Time for additional
499errors and check to see if the Response Time is consistent (let’s say 30 seconds) across all of the499errors.
NGINX access logs
To diagnose the error using NGINX access logs:
- If you are a Private Cloud user, then you can use NGINX access logs to determine
the key information about HTTP
499errors. - Check the NGINX access logs:
/opt/apigee/var/log/edge-router/nginx/ORG~ENV.PORT#_access_log - Search to see if there are any
499Errors during a specific duration (if the problem happened in the past) or if there are any requests still failing with499. - Note the following information for some of the
499errors:- Total Response Time
- Request URI
- User Agent
Sample 499 error from NGINX access log:
2019-08-23T06:50:07+00:00       rrt-03f69eb1091c4a886-c-sy      50.112.119.65:47756
10.10.53.154:8443       10.001  -       -       499     -       422     0
   GET /v1/products HTTP/1.1        -       okhttp/3.9.1    api.acme.org
rrt-03f69eb1091c4a886-c-sy-13001-6496714-1
    50.112.119.65   -       -       -       -       -       -       -       -1      -       -       dc-1  router-pod-1
rt-214-190301-0020137-latest-7d
36       TLSv1.2 gateway-1     dc-1  acme    prod  https   -
For this example, we see the following information:
- Total response time:
10.001seconds. This indicates that the client timed out after 10.001 seconds - Request:
GET /v1/products - Host:
api.acme.org - User Agent:
okhttp/3.9.1
- Check to see if the Total Response Time and User Agent is consistent
across all
499errors.
Cause: Client abruptly closed the connection
Diagnosis
- When an API is called from a single page app running in a browser or mobile application, the browser will abort the request if the end user suddenly closes the browser, navigates to another webpage in the same tab, or stops the page from loading by clicking or tapping stop loading.
- If this happens, the transactions with HTTP
499status would typically vary in request processing time (Response Time) for each of the requests. -
You can determine if this is the cause by comparing the Response Time and verifying if
it is different for each of the
499errors using API Monitoring or NGINX Access logs as explained in Common diagnosis steps.
Resolution
- This is normal and isn't usually a cause for concern if the HTTP
499errors are happening in small quantities. -
If it is happening often for the same URL path, it could be because the particular proxy associated with that path is very slow and users are not willing to wait.
Once you know which proxy may be impacted, use the Latency analysis dashboard to further investigate what is causing proxy latency.
- In this case, determine the proxy which is impacted using the steps in Common diagnosis steps.
- Use the Latency analysis dashboard to further investigate what is causing proxy latency and fix the issue.
- If you find that the latency is expected for the specific Proxy, then you may have to inform your users that this Proxy will take some time to respond.
Cause: Client application timeout
This can occur under a number of scenarios.
-
It is expected that the request will take a certain time (let’s say 10 seconds) to complete
under normal operating conditions. However, the client application is set with an incorrect
timeout value (let’s say 5 seconds) which causes the client application to timeout before
the API request is completed, leading to
499. In this case, we need to set the client timeout to an appropriate value. - A target server or callout is taking longer than expected. In this case, you need to fix the appropriate component and also adjust the timeout values appropriately.
- The Client no longer needed the response and therefore aborted. This can happen for high frequency APIs such as auto-complete or short polling.
Diagnosis
API Monitoring or NGINX access logs
Diagnose the error using API Monitoring or NGINX access logs:
- Check the API Monitoring logs or NGINX access logs for the HTTP
499transactions as explained in Common diagnosis steps. - Determine if the Response Time is consistent for all of the
499errors. - If yes, then it could be that a particular client application has configured a fixed timeout
on its end. If an API proxy or target server is responding slowly, the client would time out
before the proxy times out, resulting in large quantities of HTTP
499sfor the same URI path. In this case, determine the User Agent from the NGINX access logs which can help you to determine the specific client application. - It could also be possible that there is a load balancer in front of Apigee such as Akamai, F5, AWS ELB, and so on. If Apigee is running behind a custom load balancer, the request timeout of the load balancer must be configured to be more than the Apigee API timeout. By default, the Apigee Router times out after 57 seconds, so it's suitable to configure a request timeout of 60 seconds on the load balancer.
Trace
Diagnose the error using Trace
If the issue is still active (499 errors are still happening), then perform the
following steps:
- Enable the trace session for the affected API in Edge UI.
- Either wait for the error to occur, or if you have the API call, then make some API calls and reproduce the error.
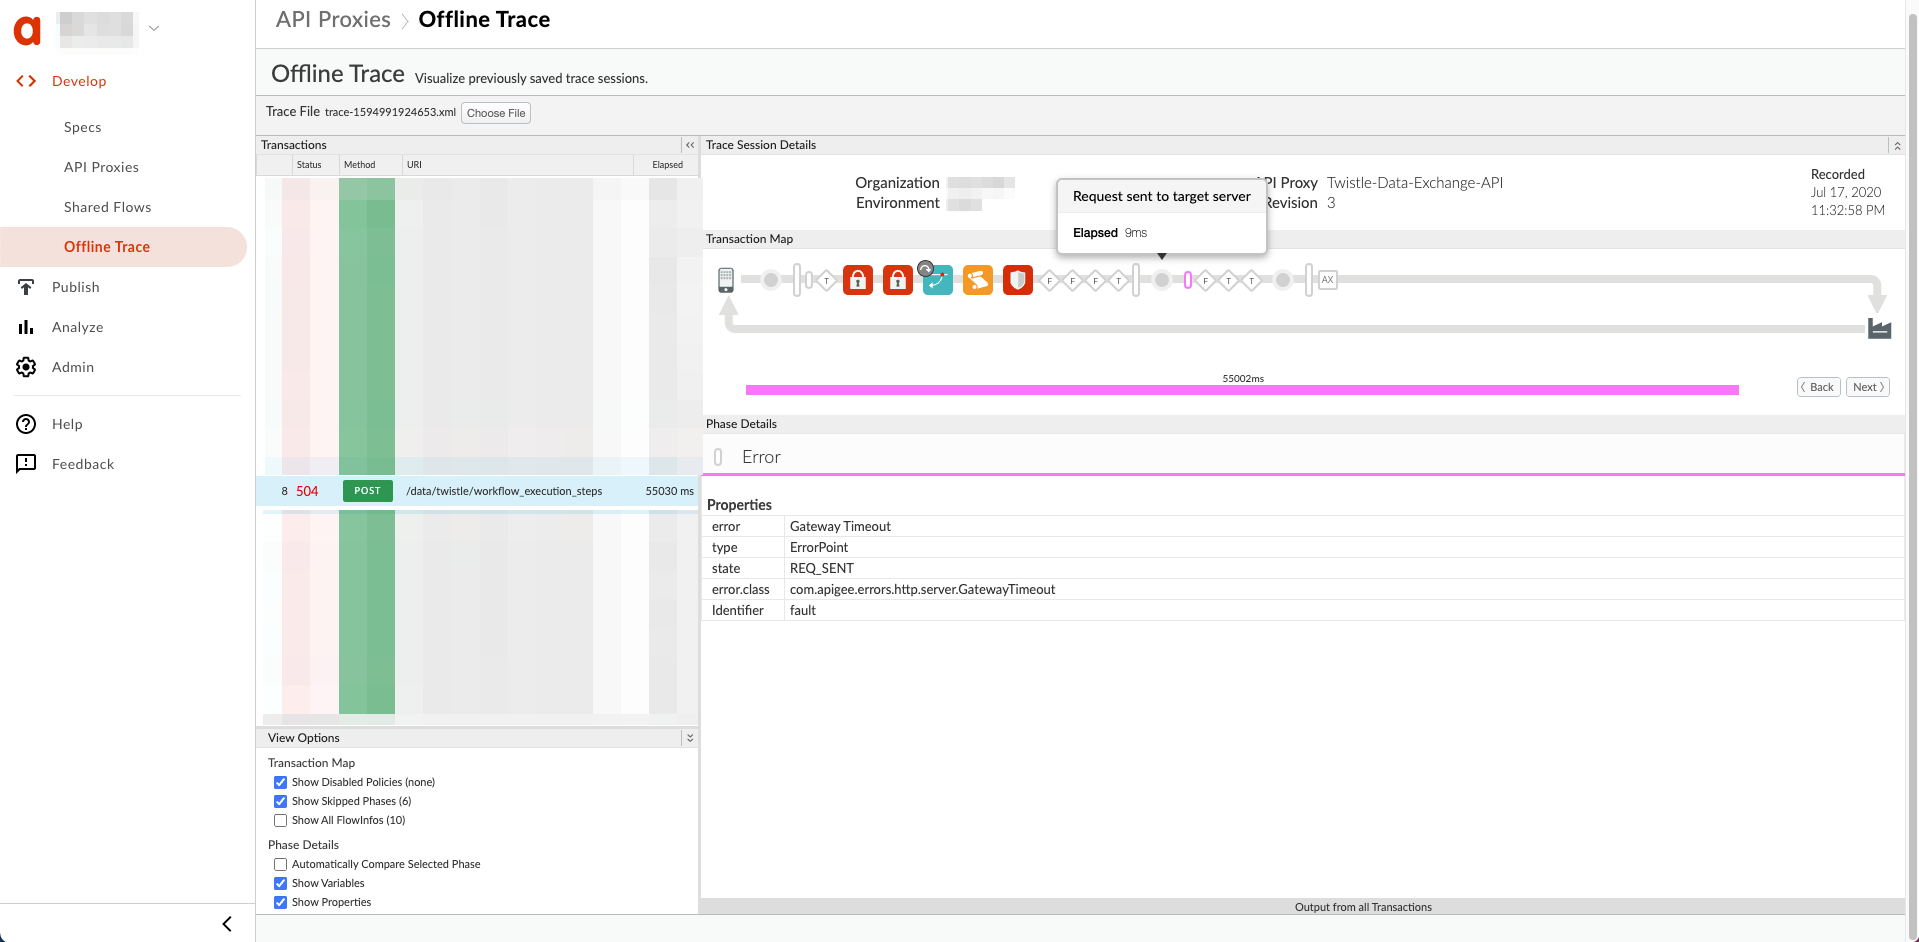
- Check the elapsed time at each phase and make a note of the phase where most of the time is spent.
- If you observe the error with the longest elapsed time immediately after one of the
following phases, then it indicates that the backend server is slow or taking a long time
to process the request:
- Request sent to target server
- ServiceCallout policy
Here's a sample UI trace showing a Gateway Timeout after the Request was sent to the target server:
Resolution
- Refer to Best practices for configuring I/O timeout to understand what timeout values should be set on different components involved in the API request flow through Apigee Edge.
- Ensure that you set an appropriate timeout value on the client application according to the best practices.
If the issue still persists, go to Must gather diagnostic information .
Must gather diagnostic information
If the issue persists, gather the following diagnostic information and then contact Apigee Edge Support.
If you are a Public Cloud user, provide the following information:
- Organization name
- Environment name
- API Proxy name
- Complete
curlcommand used to reproduce the timeout error - Trace file for the API requests for which you are seeing client timeout errors
If you are a Private Cloud user, provide the following information:
- Complete error message observed for the failing requests
- Environment name
- API Proxy bundle
- Trace file for the API requests for which you are seeing client timeout errors
- NGINX access logs (
/opt/apigee/var/log/edge-router/nginx/ORG~ENV.PORT#_access_log) - Message Processor system logs (
/opt/apigee/var/log/edge-message-processor/logs/system.log)