
You're viewing Apigee Edge documentation.
Go to the
Apigee X documentation. info
Videos
Watch the following videos to learn more about solving 500 Internal Server Errors.
| Video | Description |
|---|---|
| Introduction | Provides an introduction to 500 Internal Server Errors and possible causes. Also demonstrates a real time 500 Internal Server error along with steps to troubleshoot and resolve the error. |
| Handle Service Callout and Extract Variable errors | Demonstrates two 500 Internal Server Errors caused by Service Callout and Extract Variable policies and shows how to troubleshoot and resolve these errors. |
| Handle JavaScript policy errors | Shows a 500 Internal Server Error caused by a JavaScript policy and the steps to troubleshoot and resolve this error. |
| Handle failures from backend servers | Shows example 500 Internal Server Errors caused by a failure in backend server and shows steps to resolve the errors. |
Symptom
The client application gets an HTTP status code of 500 with the message "Internal Server Error" as a response for API calls. The 500 Internal Server error could be caused by an error during the execution of any policy within Edge or by an error on the target/backend server.
The HTTP status code 500 is a generic error response. It means that the server encountered an unexpected condition that prevented it from fulfilling the request. This error is usually returned by the server when no other error code is suitable.
Error Messages
You may get the following error message:
HTTP/1.1 500 Internal Server Error
In some cases, you may observe another error message which has more details. Here is a sample error message:
{
   "fault":{
      "detail":{
         "errorcode":"steps.servicecallout.ExecutionFailed"
      },
      "faultstring":"Execution of ServiceCallout callWCSAuthServiceCallout failed. Reason: ResponseCode 400 is treated as error"
   }
}
Possible Causes
The 500 Internal Server Error could be thrown due to a number of different causes. In Edge, the causes can be classified into two main categories based on where the error occurred:
| Cause | Details | Detailed Troubleshooting Steps are Provided For |
| Execution Error in an Edge Policy | A Policy within the API proxy may fail for some reason. | Edge Private and Public Cloud users |
| Error in the Backend Server | The backend server may fail for some reason. | Edge Private and Public Cloud users |
Execution Error in an Edge Policy
A Policy within the API proxy may fail for some reason. This section explains how to troubleshoot the issue if the 500 Internal Server Error occurs during the execution of a policy.
Diagnosis
Diagnostic Steps for Private and Public Cloud Users
If you have the trace UI session for the error, then:
- Verify that the error was caused by the execution of a policy. See Determining the source of the problem for details.
- If the error occurred during policy execution, continue.. If the error was caused by the backend server, go to Error in the Backend Server.
- Select the API request that is failing with 500 Internal Server Error in the trace.
- Examine the request and select the specific policy that has failed or the flow named "Error" that is immediately following the failed policy in the trace.
- Get more details about the error either by checking the "error" field under the Properties section or the Error content.
- Using the details you've collected about the error, try to determine its cause.
Diagnostic Steps for Private Cloud Users Only
If you don't have the trace UI session, then:
- Verify that the error occurred during the execution of a policy. See Determining the source of the problem for details.
- If the error was caused by policy execution, continue. If the error occurred during policy execution, continue. If the error was caused by the backend server, go to Error in the Backend Server.
- Use the NGINX access logs as explained in Determining the source of the problem to determine the failing policy in the API proxy and also the unique request message id
- Check the Message Processor logs
(
/opt/apigee/var/log/edge-message-processor/logs/system.log) and search for the unique request message id in it. - If you do find the unique request message ID, see if you can get more information about the cause for the failure.
Resolution
If you have determined the cause of the issue with the policy, try to correct the problem by fixing the policy and redeploying the proxy.
The following examples illustrate how to determine the cause and resolution for different types of issues.
If you need further assistance in troubleshooting 500 Internal Server Error or you suspect that it's an issue within Edge, contact Apigee Support.
Example 1: Failure in Service Callout policy due to an error in the backend server
If the call to the backend server fails within the Service Callout policy with any error such as 4XX or 5XX, then it will be treated as 500 Internal Server Error.
- Here's an example where the backend service fails with a 404 error within the Service
Callout policy. The following error message is sent to the end user:
{ "fault": { "detail": { "errorcode":"steps.servicecallout.ExecutionFailed" },"faultstring":"Execution of ServiceCallout service_callout_v3_store_by_lat_lon failed. Reason: ResponseCode 404 is treated as error" } } } - The following trace UI session shows 500 status code caused due to an error in Service
Callout policy:
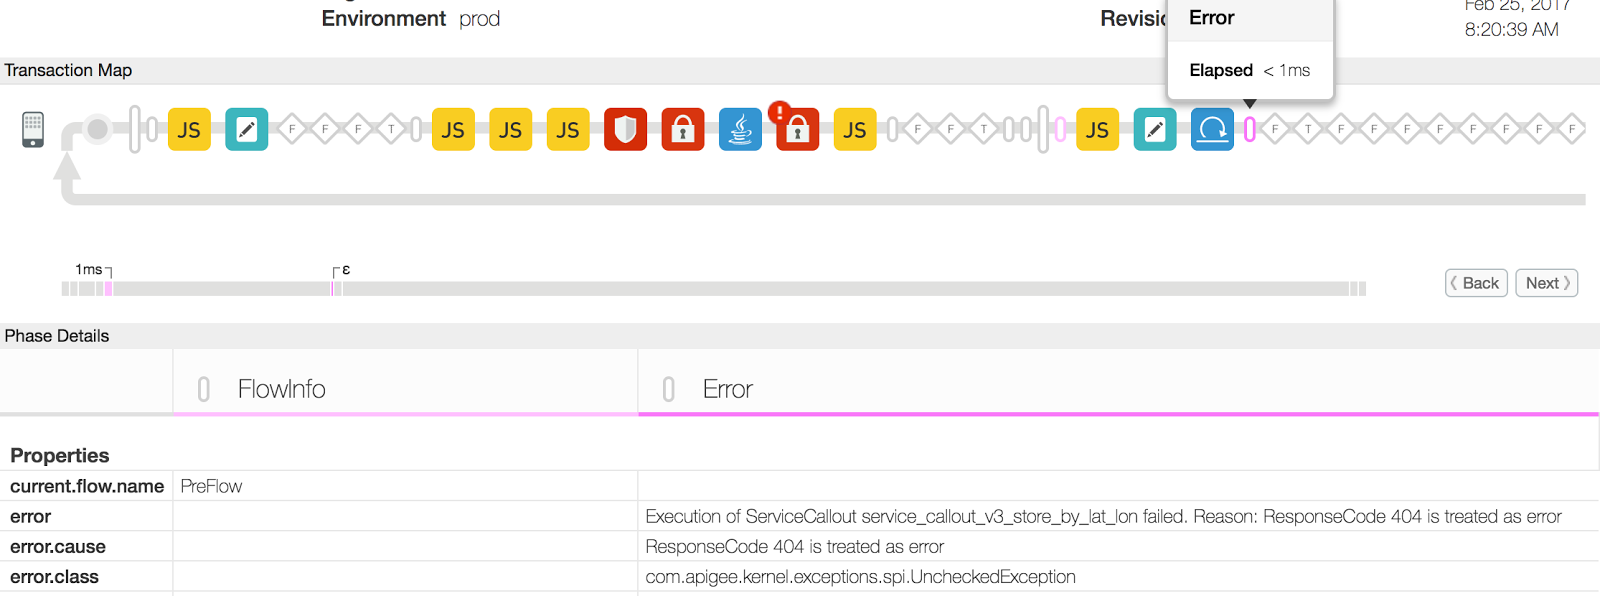
- In this example, the "error" property lists the reason for the Service Callout policy failure as "ResponseCode 404 is treated as error". This error might occur if the resource being accessed via the backend server URL in the Service Callout policy is not available.
- Check the availability of the resource on the backend server. It might not be available temporarily/permanently or it might have been moved to a different location.
Example 1 Resolution
- Check the availability of the resource on the backend server. It might not be available temporarily/permanently or it might have been moved to a different location.
- Fix the backend server URL in the Service Callout policy to point to a valid and existing resource.
- If the resource is only temporarily unavailable, then try making the API request once the resource is available.
Example 2: Failure in Extract Variables Policy
Let's now look at another example, where 500 Internal Server Error is caused due to an error in the Extract Variables policy and see how to troubleshoot and resolve the issue.
- The following trace in UI session shows 500 status code due to an error in Extract
Variables policy:
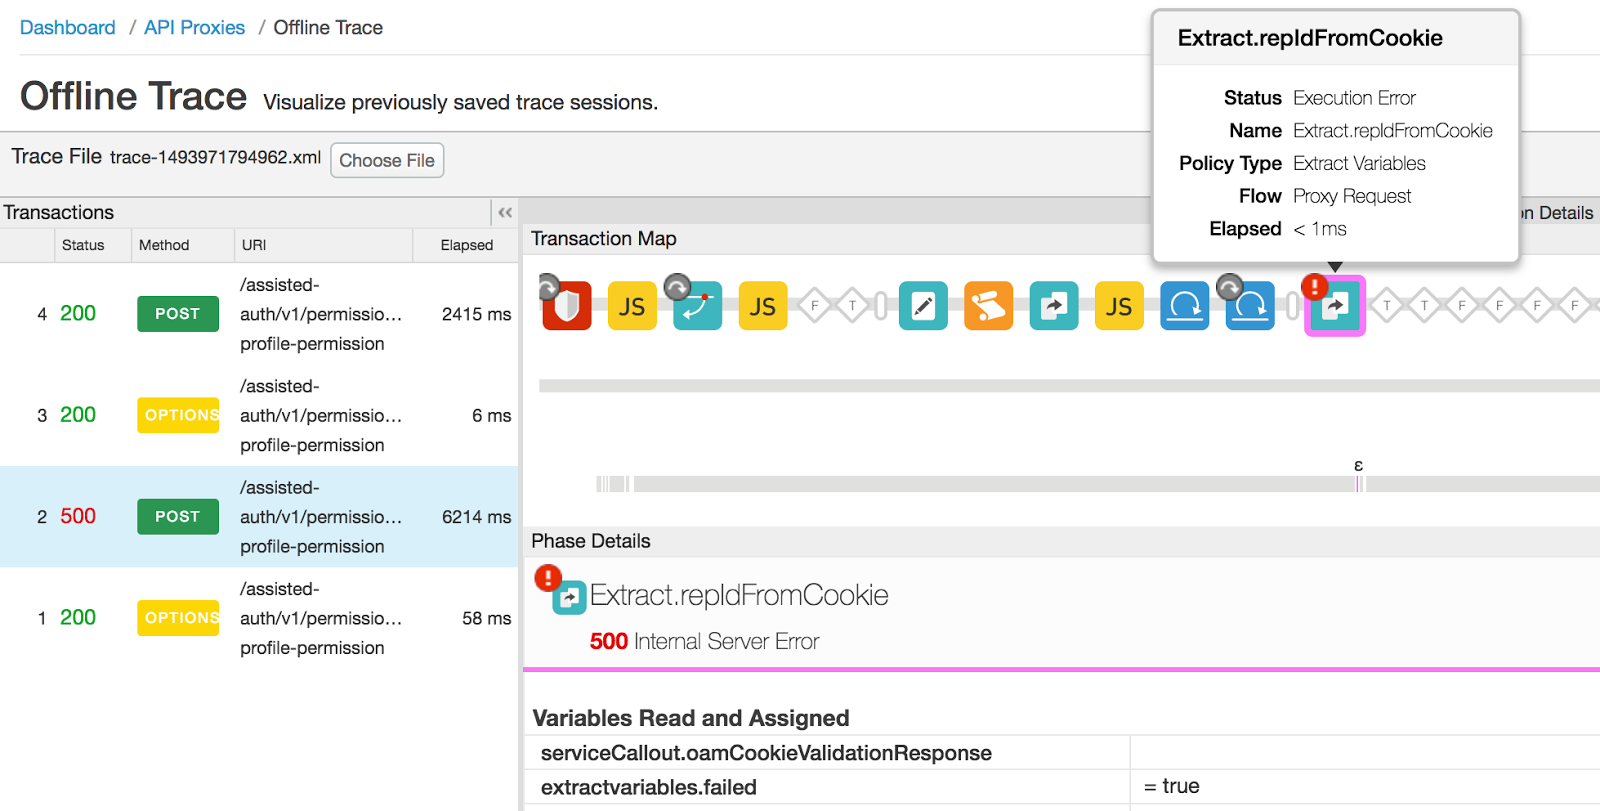
- Select the failing Extract Variables policy, scroll down and look at the "Error
Content" section for more details:
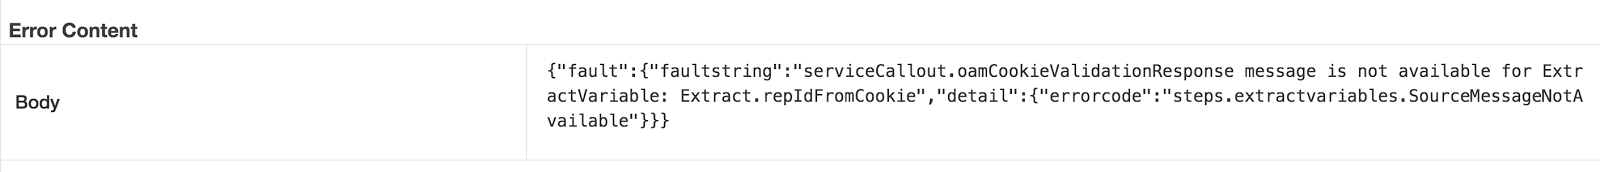
- The Error Content indicates that the"serviceCallout.oamCookieValidationResponse" variable is not available in the Extract Variables policy. As the name of the variable indicates, it should be holding the response of the preceding Service Callout policy.
- Select the Service Callout policy in the trace and you might find that the "serviceCallout.oamCookieValidationResponse" variable was not set. This indicates that the call to the backend service failed, resulting in an empty response variable.
- Though the Service Callout policy has failed, the execution of the policies after Service
Callout policy continue because the "continueOnError" flag in the Service Callout policy is set
to true, as shown below:
<ServiceCallout async="false" continueOnError="true" enabled="true" name="Callout.OamCookieValidation">
  <DisplayName>Callout.OamCookieValidation</DisplayName>
  <Properties />
  <Request clearPayload="true" variable="serviceCallout.oamCookieValidationRequest">
    <IgnoreUnresolvedVariables>false</IgnoreUnresolvedVariables>
  </Request>
  <Response>serviceCallout.oamCookieValidationResponse</Response>
  <HTTPTargetConnection>
    <Properties />
    <URL>http://{Url}</URL>
  </HTTPTargetConnection>
</ServiceCallout>
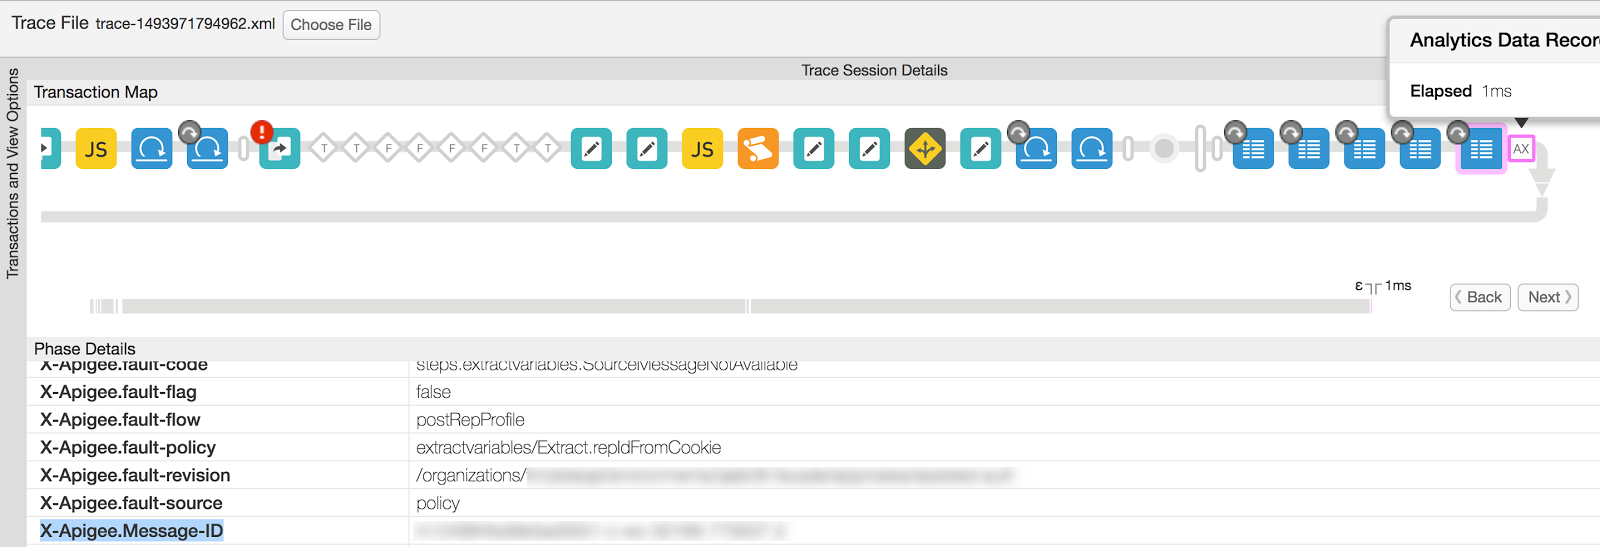
- Note the unique message id "X-Apigee.Message-ID" for this specific API
request from the trace, as follows:
- Select the "Analytics Data Recorded" phase from the request.
- Scroll down and note the value of X-Apigee.Message-ID.
- View the Message Processor log
(
/opt/apigee/var/log/edge-message-processor/system.log) and search for the unique message id noted down in step #6. The following error message was observed for the specific API request:2017-05-05 07:48:18,653 org:myorg env:prod api:myapi rev:834 messageid:rrt-04984fed9e5ad3551-c-wo-32168-77563 NIOThread@5 ERROR HTTP.CLIENT - HTTPClient$Context.onTimeout() : ClientChannel[C:]@149081 useCount=1 bytesRead=0 bytesWritten=0 age=3002ms lastIO=3002ms .onConnectTimeout connectAddress=mybackend.domain.com/XX.XX.XX.XX:443 resolvedAddress=mybackend.domain.com/XX.XX.XX.XX
The above error indicates that the Service Callout policy failed due to a connection timeout error while connecting to the backend server.
- To determine the cause for the connection timeout error, executed the
telnet command to the backend server from the Message Processor(s). The telnet
command gave "Connection timed out" error as shown below:
telnet mybackend.domain.com 443
Trying XX.XX.XX.XX...
telnet: connect to address XX.XX.XX.XX: Connection timed out
Typically, this error is observed under the following circumstances:
- When the backend server is not configured to allow traffic from the Edge Message Processors.
- If the backend server is not listening on the specific port.
In the above illustrated example, though the Extract Variables policy failed, the actual cause was that Edge was unable to connect to the backend server in the Service Callout policy. And the cause for this failure was that the backend end server was not configured to allow traffic from the Edge Message Processors.
Your own Extract Variables policy will behave differently and may fail for a different reason. You can troubleshoot the issue appropriately depending on the cause for failure of your Extract Variables policy by checking the message in the error property.
Example 2 Resolution
- Fix the cause for error or failure in Extract Variables policy appropriately.
- In the illustrated example above, the solution was to rectify the network configuration to allow the traffic from Edge Message Processors to your backend server. This was done by allowlisting the Message Processors' IP addresses on the specific backend server. For example, on Linux, you could use iptables to allow the traffic from Message Processor's IP addresses on the backend server.
Example 3: Failure in JavaCallout policy
Let's now look at one more example, where 500 Internal Server Error is caused due to an error in Java Callout policy and see how to troubleshoot and resolve the issue.
- The following UI trace shows 500 status code due to an error in Java Callout Policy:
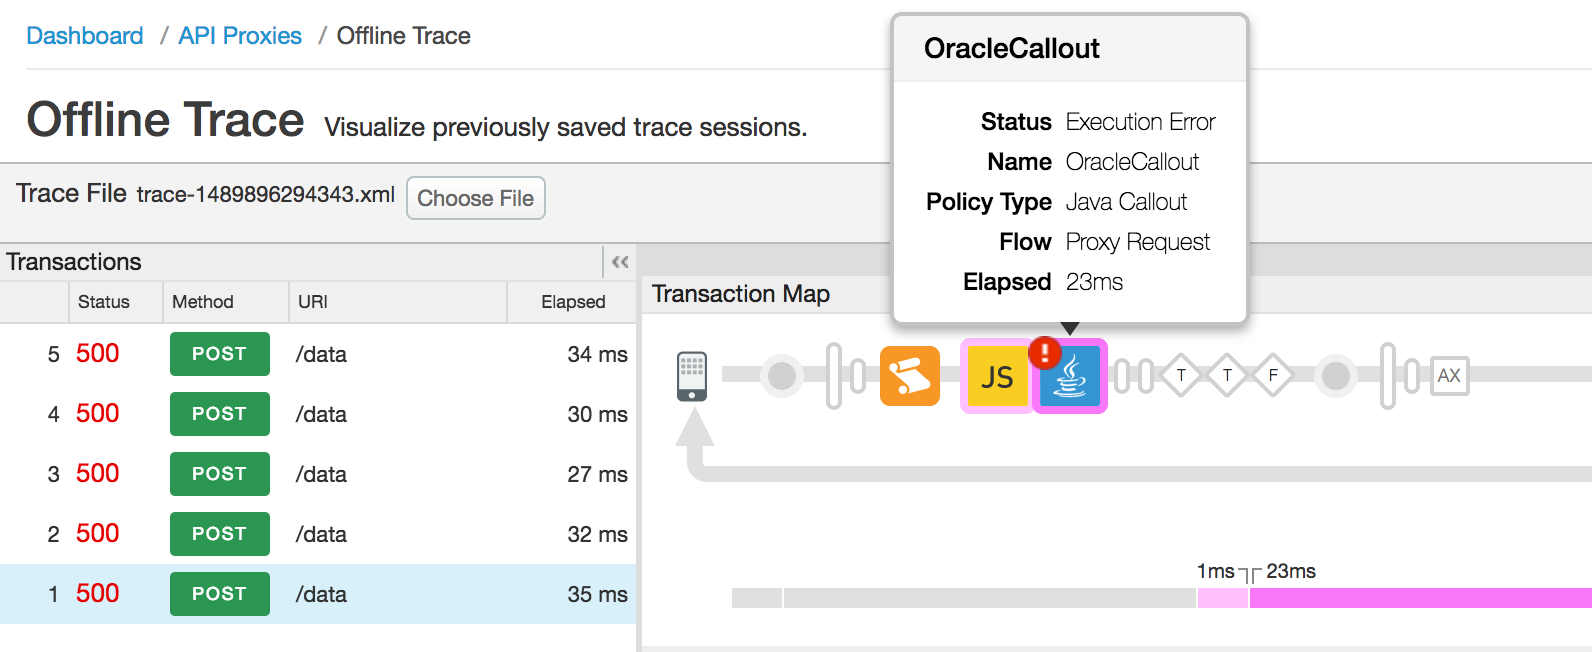
- Select the Flow named "Error" followed by the failed Java Callout Policy
to get the error details as shown in the figure below:
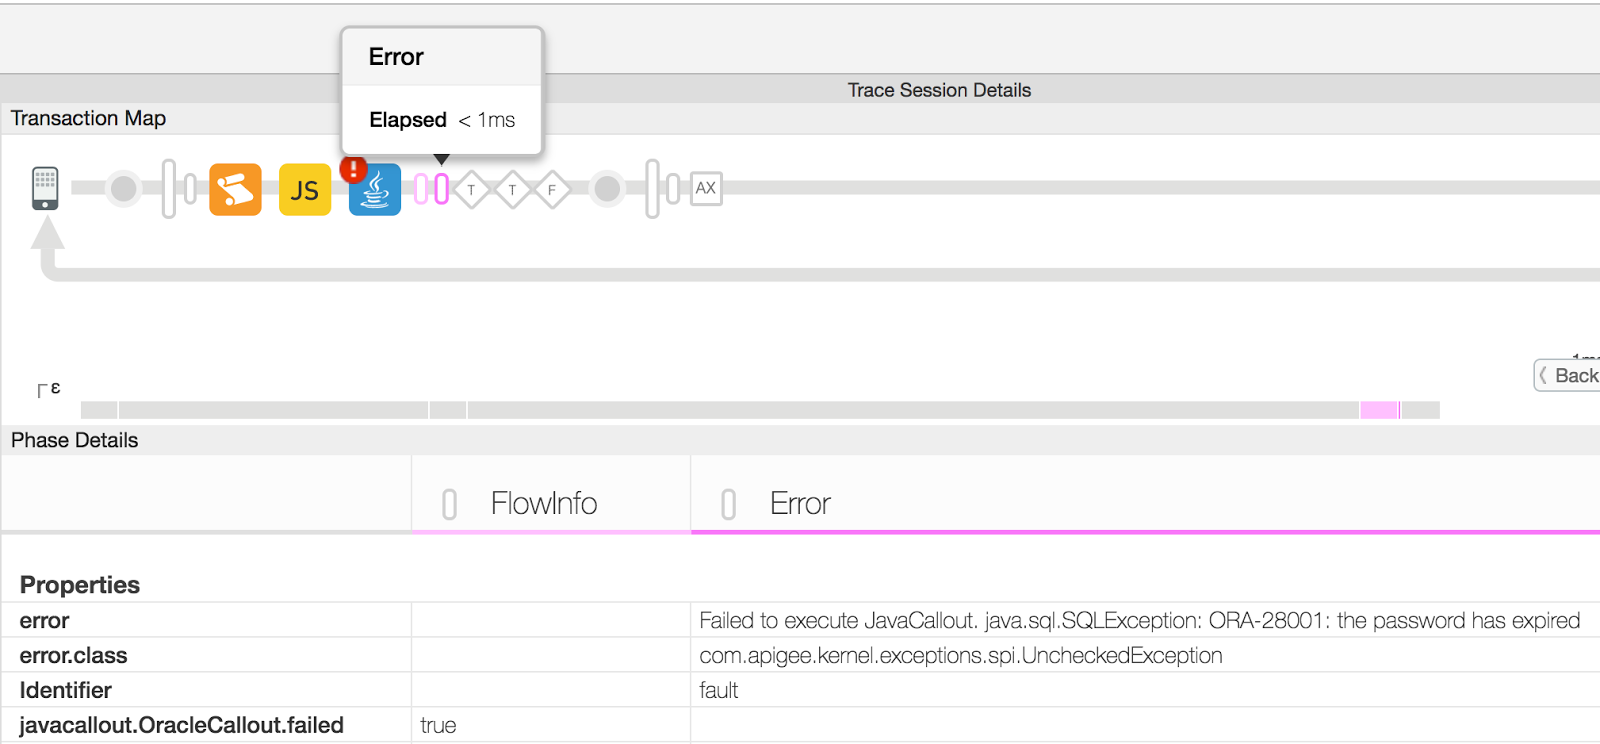
- In this example, the "error" property under the Properties section reveals that the failure is due to expired password being used while connecting to the Oracle Database from within the JavaCallout policy. Your own Java callout will behave differently and will populate a different message in the error property.
- Check the JavaCallout policy code and confirm the correct configuration that needs to be used.
Example 3 Resolution
Fix the Java callout code or configuration appropriately to avoid the runtime exception. In the illustrated Java callout failure example above, one would need to use the correct password for connecting to the Oracle database to resolve the issue.
Error in the Backend Server
A 500 Internal Server Error could also originate from the backend server. This section explains how to troubleshoot the issue if the error comes from the backend server.
Diagnosis
Diagnostic Steps for All Users
The cause of other backend errors can vary widely. You will need to diagnose each situation independently.
- Verify that the error was caused by the backend server. See Determining the source of the problem for details.
- If the error was caused by the backend server, continue. If the error occurred during policy execution, go to Execution Error in Edge Policy.
- Follow the steps below depending on whether or not you have access to a Trace session for the failed API, or if the backend is a Node.js server:
If you do not have a Trace session for the failed API call:
- If the UI trace is not available for the failing request, then check the backend server logs to get details about the error.
- If possible, enable the debug mode on the backend server to get more details about the error and the cause.
If you do have a Trace session for the failed API call:
If you have a Trace session, then the following steps will help you diagnose the problem.
- In the Trace tool, select the API request that has failed with 500 Internal Server Error.
- Select the "Response received from target server" phase from the failing
API request as shown in the figure below:
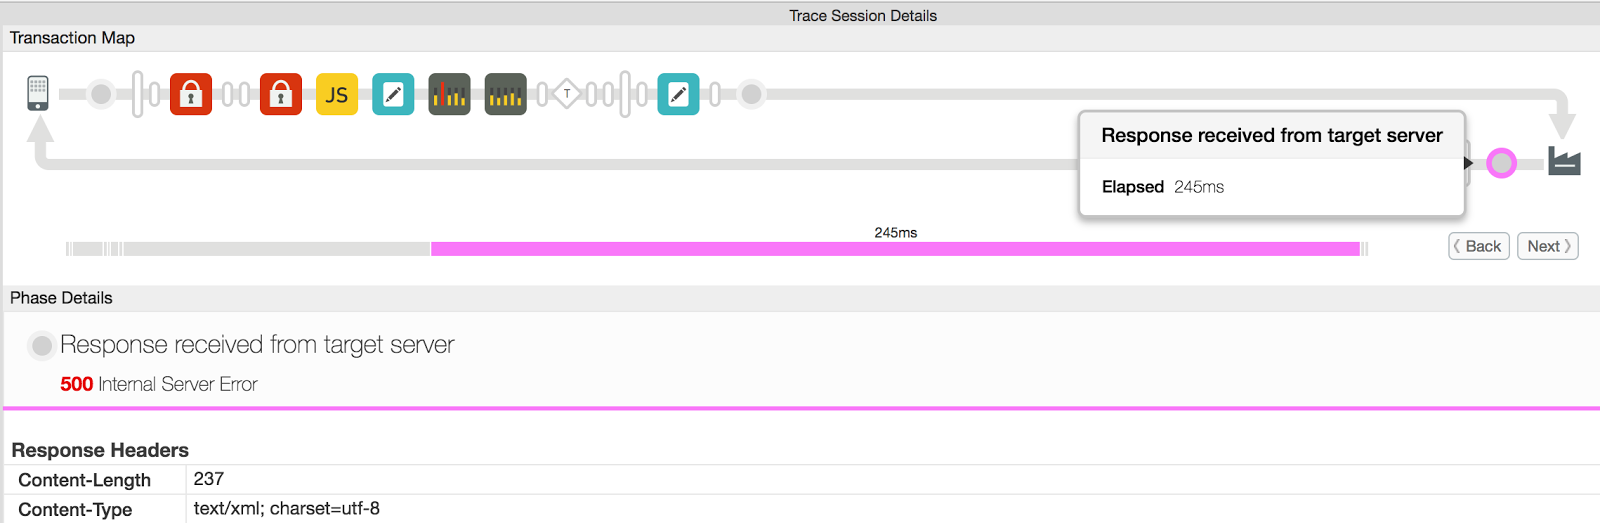
- Check the "Response Content" section to get details about the error.
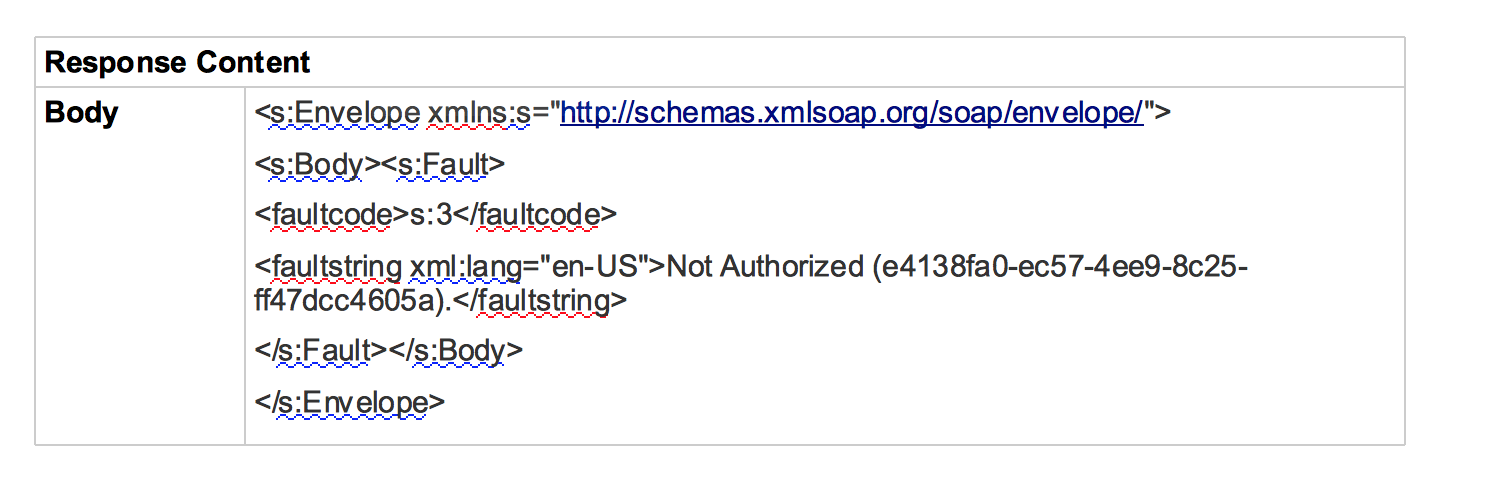
- In this example, the Response Content which is a SOAP Envelope, shows the fault string as "Not Authorized" message. The most likely cause for this issue is that the proper credentials (username/password, access token, etc.) are not passed to the backend server by the user. This issue can be fixed by passing the correct credentials to the backend server.
If the backend is a Node.js server:
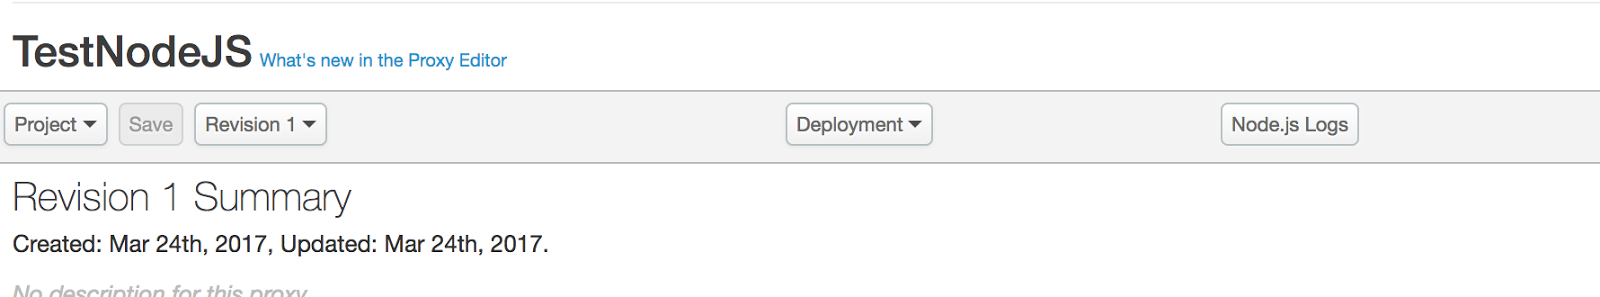
- If the backend is a Node.js Backend Server, then check the Node.js logs
for the specific API Proxy in the Edge UI (both Public and Private Cloud users can
check the Node.js logs). If you are an Edge Private Cloud user, you
can also check your Message Processor logs
(
/opt/apigee/var/log/edge-message-processor/logs/system.log) for more details about the error.
NodeJS Logs option in the Edge UI - Overview Tab of API Proxy
Resolution
- Once you've identified the cause of the error, fix the issue in your backend server.
- If it's a Node.js backend server:
- Check if the error is thrown from your custom code and fix the issue, if possible.
- If the error is not thrown from your custom code or if you need assistance, contact Apigee Support.
If you need further assistance in troubleshooting 500 Internal Server Error or you suspect that it's an issue within Edge, contact Apigee Support.
Determining the source of the problem
Use one of the following procedures to determine if the 500 Internal Server Error was thrown during the execution of a policy within the API proxy or by the backend server.
Using Trace in UI
Note: The steps in this section can be performed by both Public and Private Cloud users.
- If the issue is still active, enable the trace in UI for the affected API.
- Once you have captured the trace, select the API request that shows the response code as 500.
- Navigate through all the phases of the failing API request and check which phase returns
the 500 Internal Server Error:
- If the error is thrown during the execution of a policy, then proceed to Execution Error in an Edge Policy.
- If the backend server has responded with 500 Internal Server, then proceed to Error in the Backend Server.
Using API Monitoring
Note: The steps in this section can be performed by Public Cloud users only.
API Monitoring enables you to isolate problem areas quickly to diagnose error, performance, and latency issues and their source, such as developer apps, API proxies, backend targets, or the API platform.
Step through a sample scenario that demonstrates how to troubleshoot 5xx issues with your APIs using API Monitoring.
For example, you may want to set up an alert to be notified when the number of 500 status codes or steps.servicecallout.ExecutionFailed faults exceeds a particular threshold.
Using NGINX Access Logs
Note: The steps in this section are for Edge Private Cloud users only.
You can also refer to NGINX Access logs to determine whether the 500 status code was thrown during the execution of a policy within the API proxy or by the backend server. This is particularly useful if the issue has occurred in the past or if the issue is intermittent and you are unable to capture the trace in UI. Use the following steps to determine this information from NGINX access logs:
- Check the NGINX access logs (
/opt/apigee/var/log/edge-router/nginx/ <org>~
    <env>.<port#>_access_log
). - Search if there are any 500 Errors for the specific API proxy at the specific duration.
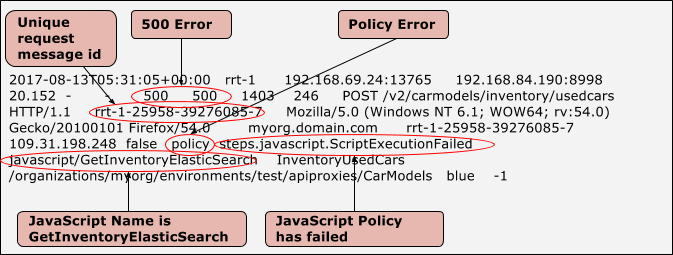
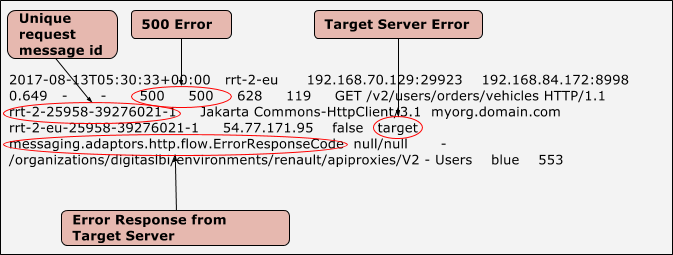
- If there are any 500 Errors, then check if the error is a policy or a target server error,
as shown below:
Sample Entry showing a Policy Error
Sample Entry showing a Target Server Error
- Once you've identified whether it is a policy or target server error:
- Proceed to Execution Error in an Edge Policy if it is a policy error.
- Proceed to Error in Backend Server if it is a target server error.