
You're viewing Apigee Edge documentation.
Go to the
Apigee X documentation. info
Symptom
The client application receives an HTTP status code of 504 with the message
Gateway Timeout as a response for the API calls.
The HTTP status code - 504 Gateway Timeout error indicates that the client
did not receive a timely response from the Edge Gateway or backend server during the execution of
an API
Error messages
Client application gets the following response code:
HTTP/1.1 504 Gateway Timeout
In some cases, the following error message may also be observed:
{
   "fault": {
      "faultstring": "Gateway Timeout",
      "detail": {
           "errorcode": "messaging.adaptors.http.flow.GatewayTimeout"
       }
    }
}
What causes gateway timeouts?
Typical path for an API request via the Edge platform will be Client -> Router -> Message Processor -> Backend Server as shown in the below figure:
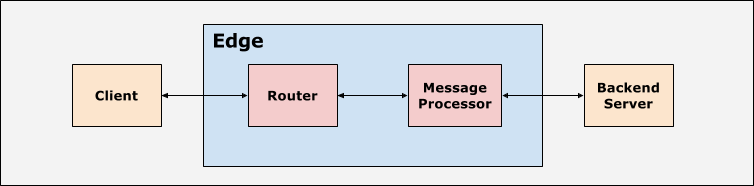
The client application, routers, and Message Processors within Edge platform are set up with
suitable timeout values. The Edge platform expects a response to be sent within a certain period
of time for every API request based on the timeout values. If you don't get the response within
the specified period of time, then 504 Gateway Timeout Error is returned.
The following table provides more details about when timeouts may occur in Edge:
| Timeout occurrence | Details |
|---|---|
| Timeout occurs on Message Processor |
|
| Timeout occurs on Router |
|
| Timeout occurs on client application |
|
Possible causes
In Edge, the typical causes for 504 Gateway Timeout error are:
| Cause | Details | Steps given for |
|---|---|---|
| Slow backend server | The backend server that is processing the API request is too slow due to high load or poor performance. | Public and Private Cloud users |
| Slow API request processing by Edge | Edge takes a long time to process the API request due to high load or poor performance. |
Slow backend server
If the backend server is very slow or takes a long time to process the API request, then
you will get a 504 Gateway Timeout error. As explained in the section above, the timeout can
occur under one of the following scenarios:
- Message Processor times out before backend server responds.
- Router times out before Message Processor/backend server responds.
- Client application times out before Router/Message Processor/backend server responds.
The following sections describe how to diagnose and resolve the issue under each of these scenarios.
Scenario #1 Message Processor times out before backend server responds
Diagnosis
You can use the following procedures to diagnose if the 504 Gateway Timeout error has occurred
because of the slow backend server.
Procedure #1 Using Trace
If the issue is still active (504 errors are still happening), then follow the below
steps:
- Trace the affected API in Edge UI. Either wait for the error to occur or if you have the
API call, then make some API calls and reproduce the
504 Gateway Timeouterror. - Once the error has occurred, examine the specific request which shows the response code as
504. - Check the elapsed time at each phase and make a note of the phase where most time is spent.
- If you observe the error with the longest elapsed time immediately after one of the
following phases, then it indicates that the backend server is slow or taking a long time to
process the request:
- Request sent to target server
- ServiceCallout policy
The following provides a sample Trace showing that the backend server did not respond even
after 55 seconds resulting in a 504 Gateway Timeout error:
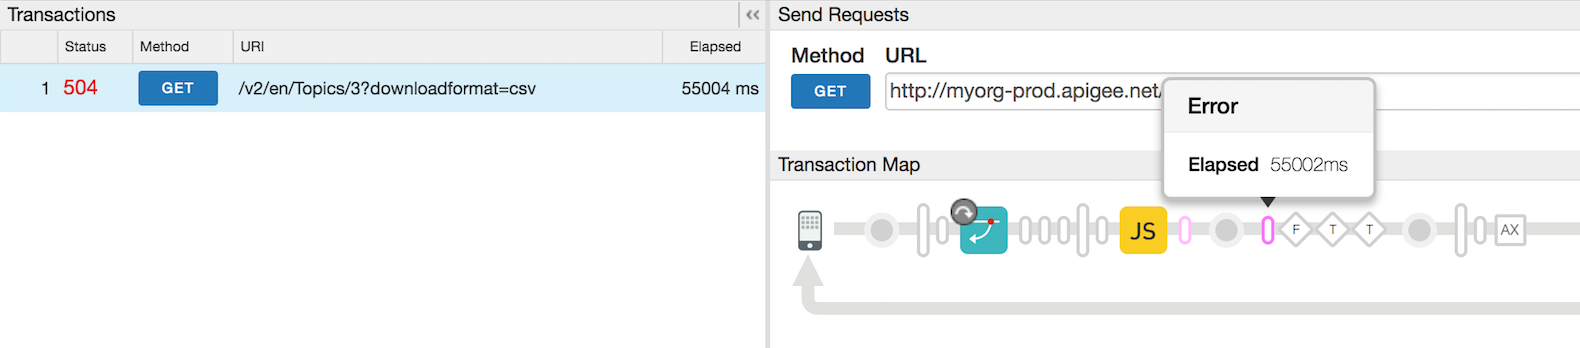
In the above trace, the Message Processor times out after 55002 ms as the backend server does not respond.
Procedure #2 Using Message Processor logs
- Check the Message Processor's log
(
/opt/apigee/var/log/edge-message-processor/logs/system.log) -
If you find
Gateway TimeoutandonTimeoutReaderrors for the specific API proxy request at the specific time, then it indicates that the Message Processor has timed out.Sample Message Processor log showing Gateway Timeout Error
2015-09-29 20:16:54,340 org:myorg env:staging api:profiles rev:13 NIOThread@1 ERROR ADAPTORS.HTTP.FLOW - AbstractResponseListener.onException() : AbstractResponseListener.onError(HTTPResponse@4d898cf1, Gateway Timeout) 2015-09-29 20:16:57,361 org:myorg env:staging api:profileNewsletters rev:8 NIOThread@0 ERROR HTTP.CLIENT - HTTPClient$Context$3.onTimeout() : SSLClientChannel[C:XX.XX.XX.XX:443 Remote host:192.168.38.54:38302]@120171 useCount=2 bytesRead=0 bytesWritten=824 age=55458ms lastIO=55000ms .onTimeoutRead
In the above Message Processor log, you notice that the backend server denoted with the IP address XX.XX.XX.XX did not respond even after 55 seconds (lastIO=55000ms). As a result, the Message Processor timed out and sent
504 Gateway Timeouterror.Check this: How is timeout controlled on Message Processor?
- How is timeout controlled on Message Processor. Message Processors are usually
set with a default timeout value of 55 seconds) via the property
HTTPTransport.io.timeout.millis. This timeout value is applicable for all the API Proxies that belong to an organization served by this Message Processor.- If the backend server does not respond within 55 seconds, then the Message
Processor times out and sends
504 Gateway Timeouterror to the client.
- If the backend server does not respond within 55 seconds, then the Message
Processor times out and sends
- The timeout value specified in the Message Processor can be
overridden by the property
io.timeout.millisspecified within the API Proxy. This timeout value is applicable to a specific API Proxy in which the above mentioned property is specified. For example, if theio.timeout.millisis set to 10 seconds within the API Proxy, then the timeout value of 10 seconds will be used for this specific API Proxy.- If the backend server does not respond within 10 seconds for the specific
API Proxy, then the Message Processor times out and sends
504 Gateway Timeouterror to the client.
- If the backend server does not respond within 10 seconds for the specific
API Proxy, then the Message Processor times out and sends
- How is timeout controlled on Message Processor. Message Processors are usually
set with a default timeout value of 55 seconds) via the property
Resolution
- Check why the backend server is taking more than 55 seconds and see if it can be fixed/optimized to respond faster.
- If it is not possible to fix/optimize the backend server or it is known that the backend server takes a longer time than the configured timeout, then Increase the timeout value on Router and Message Processor to a suitable value.
Scenario #2 - Router times out before Message Processor/backend server responds
You might get 504 Gateway Timeout errors if the router times out before the Message
Processor/backend server responds. This can happen under one of the following circumstances:
- The timeout value set on the Router is shorter than the timeout value set on the Message
Processor. For example, let's say the timeout on Router is 50 seconds, while the Message
Processor is 55 seconds.
Timeout on Router Timeout on Message Processor 50 seconds 55 seconds - The timeout value on the Message Processor is overridden with a higher timeout value using
the
io.timeout.millisproperty set within the target endpoint configuration of the API Proxy:For example, if the following timeout values are set:
Timeout on Router Timeout on Message Processor Timeout within API Proxy 57 seconds 55 seconds 120 seconds But the
io.timeout.millisis set to 120 seconds in the API Proxy:<HTTPTargetConnection> <Properties> <Property name="io.timeout.millis">120000</Property> </Properties> <URL>http://www.apigee.com</URL> </HTTPTargetConnection>Then, the Message Processor will not timeout after 55 seconds even though it's timeout value (55 seconds) is less than the timeout value on the router (57 seconds). This is because the timeout value of 55 seconds on the Message Processor is overridden by the value of 120 seconds that is set within the API Proxy. So the timeout value of the Message Processor for this specific API Proxy will be 120 seconds.
Since the Router has a lower timeout value (57 seconds) compared to 120 seconds set within the API Proxy, the router will timeout if the backend server does not respond back after 57 seconds.
Diagnosis
- Check the NGINX access log
(
/opt/apigee/var/log/edge-router/nginx/ORG~ENV.PORT#_access_log) -
If the router times out before the Message Processor, then you will see the status of
504on the NGINX access logs for the specific API request and themessage idfrom the Message Processor will be set as-. This is because the Router didn't get any response from the Message Processor within the timeout period set on the router.Sample NGINX Log Entry showing 504 due to Router timing out
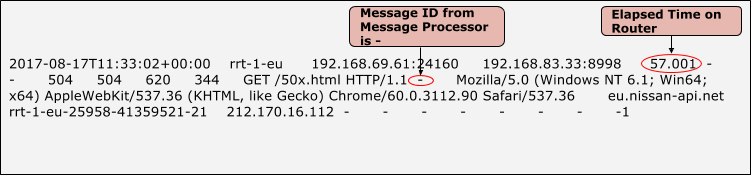
- In the above example, notice the status of
504on NGINX, the message id from the Message Processor is-and total time elapsed is 57.001 seconds. This is because the router timed out after 57.001 seconds and we didn't get any response from the Message Processor. - In this case, you will see
Broken Pipeexceptions in the Message Processor logs (/opt/apigee/var/log/edge-message-processor/logs/system.log).2017-06-09 00:00:25,886 org:myorg env:test api:myapi-v1 rev:23 messageid:rrt-mp01-18869-23151-1 NIOThread@1 INFO HTTP.SERVICE - ExceptionHandler.handleException() : Exception java.io.IOException: Broken pipe occurred while writing to channel ClientOutputChannel(ClientChannel[A:XX.XX.XX.XX:8998 Remote host:YY.YY.YY.YY:51400]@23751 useCount=1 bytesRead=0 bytesWritten=486 age=330465ms lastIO=0ms ) 2017-06-09 00:00:25,887 org:myorg env:test api:myapi-v1 rev:23 messageid:rrt-mp01-18869-23151-1 NIOThread@1 INFO HTTP.SERVICE - ExceptionHandler.handleException() : Exception trace: java.io.IOException: Broken pipe at com.apigee.nio.channels.ClientOutputChannel.writePending(ClientOutputChannel.java:51) ~[nio-1.0.0.jar:na] at com.apigee.nio.channels.OutputChannel.onWrite(OutputChannel.java:116) ~[nio-1.0.0.jar:na] at com.apigee.nio.channels.OutputChannel.write(OutputChannel.java:81) ~[nio-1.0.0.jar:na] … <snipped>
This error is displayed because once the router times out, it closes the connection with the
Message Processor. When the Message Processor completes its processing, it attempts to write the
response to the router. Since the connection to the router is already closed, you get the
Broken Pipe exception on the Message Processor.
This exception is expected to be seen under the circumstances explained above. So the actual
cause for the 504 Gateway Timeout error is still the backend server taking longer time to respond
and you need to address that issue.
Resolution
- If it's a custom backend server, then
- Check why the backend server is taking a long time to respond and see if it can be fixed/optimized to respond faster.
- If it is not possible to fix/optimize the backend server or it is a known fact that the
backend server takes a long time, then Increase the timeout value on
Router and Message Processor.
Idea: Set the timeout value on the different components in the following order:
Timeout on Client > Timeout on Router > Timeout on Message Processor > Timeout within API Proxy
- If it's a NodeJS backend server, then:
- Check if the NodeJS code makes calls to any other backend servers and if it's taking a long time to return a response. Check why the backend servers are taking longer time and fix the problem as appropriate.
- Check if the Message Processors are experiencing high CPU or Memory usage:
- If any Message Processor is experiencing high CPU usage, then generate three
thread
dumps every 30 seconds using the following command:
JAVA_HOME/bin/jstack -l PID > FILENAME
- If any Message Processor is experiencing high memory usage then generate a
heap
dump using the following command:
sudo -u apigee JAVA_HOME/bin/jmap -dump:live,format=b,file=FILENAME PID
- Restart the Message Processor using the below command. It should bring down the CPU
and memory:
/opt/apigee/apigee-service/bin/apigee-service edge-message-processor restart
- Monitor the API calls to confirm if the problem still exists.
- Contact Apigee Edge Support and provide the
thread dumps, heap dump, and Message Processor logs
(
/opt/apigee/var/log/edge-message-processor/logs/system.log)to help investigate the cause for the high CPU/memory usage.
- If any Message Processor is experiencing high CPU usage, then generate three
thread
dumps every 30 seconds using the following command:
Check This: How is timeout controlled for NodeJS backend servers on Message Processor
|
Scenario #3 - Client application times out before Router/Message Processor/backend server responds
You might get 504 Gateway Timeout errors if the client application times out before the
backend server responds. This situation can happen if:
- The timeout value set on the client application is lower than the timeout value set on the
router and Message Processor:
For example, if the following timeout values are set:
Timeout on Client Timeout on Router Timeout on Message Processor 50 seconds 57 seconds 55 seconds In this case, the total time available to get a response for an API request through Edge is <= 50 seconds. This includes the time taken to make an API request, the request being processed by Edge (Router, Message Processor), the request being sent to the backend server (if applicable), backend processing the request and sending the response, Edge processing the response and finally sending it back to the client.
If the router does not respond to the client within 50 seconds, then the client will timeout and close the connection with the router. The client will get the response code of
504.This will cause the NGINX to set a status code of
499indicating the client closed the connection.
Diagnosis
- If the client application times out before it gets a response from the router, then it will
close the connection with the router. In this situation, you will see a status code of 499 in
the NGINX access logs for the specific API request.
Sample NGINX Log Entry showing status code 499
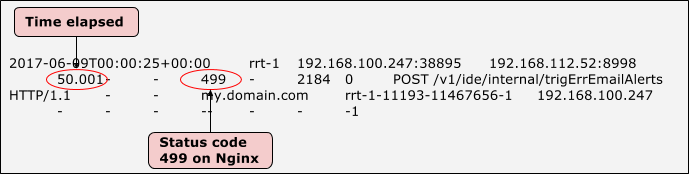
- In the above example, note that the status of
499on the NGINX and total time elapsed is 50.001 seconds. This indicates that the client timed out after 50.001 seconds. - In this case, you will see
Broken PipeExceptions in the Message Processor logs (/opt/apigee/var/log/edge-message-processor/logs/system.log).
2017-06-09 00:00:25,886 org:myorg env:test api:myapi-v1 rev:23 messageid:rrt-1-11193-11467656-1  NIOThread@1 INFO  HTTP.SERVICE - ExceptionHandler.handleException() : Exception java.io.IOException: Broken pipe occurred while writing to channel ClientOutputChannel(ClientChannel[A:XX.XX.XX.XX:8998 Remote host:YY.YY.YY.YY:51400]@23751 useCount=1 bytesRead=0 bytesWritten=486 age=330465ms  lastIO=0ms )
2017-06-09 00:00:25,887  org:myorg env:test api:myapi-v1 rev:23 messageid:rrt-1-11193-11467656-1  NIOThread@1 INFO  HTTP.SERVICE - ExceptionHandler.handleException() : Exception trace:
java.io.IOException: Broken pipe
        at com.apigee.nio.channels.ClientOutputChannel.writePending(ClientOutputChannel.java:51) ~[nio-1.0.0.jar:na]
        at com.apigee.nio.channels.OutputChannel.onWrite(OutputChannel.java:116) ~[nio-1.0.0.jar:na]
        at com.apigee.nio.channels.OutputChannel.write(OutputChannel.java:81) ~[nio-1.0.0.jar:na]
         … <snipped>
- After the Router times out, it closes the connection with the Message Processor. When the
Message Processor completes its processing, it attempts to write the response to the Router.
Since the connection to the Router is already closed, you get the
Broken Pipe
    exception
on the Message Processor. - This exception is expected under the circumstances explained above. So the actual cause for
the
504 Gateway Timeouterror is still that the backend server takes a long time to respond and you need to address that issue.
Resolution
- If it's your custom backend server then:
- Check the backend server to determine why it is taking more than 57 seconds and see if it can be fixed/optimized to respond faster.
- If it is not possible to fix/optimize the backend server or if you know that the
backend server will take a long time, then increase the timeout value on
router and Message Processor.
Idea: Set the timeout value on the different components in the following order:
Timeout on Client > Timeout on Router > Timeout on Message Processor > Timeout within API Proxy
- If it's a NodeJS backend, then:
- Check if the NodeJS code makes calls to any other backend servers and if that's taking a long time to return. Check why those backend servers are taking longer time.
- Check if the Message Processors are experiencing high CPU or memory usage:
- If a Message Processor is experiencing high CPU usage, then generate three
thread
dumps every 30 seconds using the following command:
JAVA_HOME/bin/jstack -l PID > FILENAME
- If a Message Processor is experiencing high memory usage, then generate a
heap dump
using the following command:
sudo -u apigee JAVA_HOME/bin/jmap -dump:live,format=b,file=FILENAME PID
- Restart the Message Processor using the below command. This should bring down the
CPU and memory:
/opt/apigee/apigee-service/bin/apigee-service edge-message-processor restart
- Monitor the API calls to confirm if the problem still exists.
- Contact Apigee Edge Support and provide the
thread dumps, heap dump, and Message Processor logs
(
/opt/apigee/var/log/edge-message-processor/logs/system.log)to help them investigate the cause for the high CPU/memory usage.
- If a Message Processor is experiencing high CPU usage, then generate three
thread
dumps every 30 seconds using the following command:
Increase the timeout value on Router and Message Processor
Choose the timeout values to be set on the Router and Message Processor carefully depending on your requirements. Don't set arbitrarily large timeout values. If you need assistance, contact Apigee Edge Support.
Router
chown apigee:apigee /opt/apigee/customer/application/router.properties
- Create the
/opt/apigee/customer/application/router.propertiesfile on the Router machine, if it does not already exist. - Add the following line to this file:
conf_load_balancing_load.balancing.driver.proxy.read.timeout=TIME_IN_SECONDS
For example, if you want to set the timeout value of 120 seconds, then set it as follows:
conf_load_balancing_load.balancing.driver.proxy.read.timeout=120
- Ensure this file is owned by apigee:
- Restart the router:
/opt/apigee/apigee-service/bin/apigee-service edge-router restart
- If you have more than one router, repeat the above steps on all the routers.
Message Processor
- Create
/opt/apigee/customer/application/message-processor.propertiesfile on the Message Processor machine, if it does not already exist. - Add the following line to this file:
conf_http_HTTPTransport.io.timeout.millis=TIME_IN_MILLISECONDS
For example, if you want to set the timeout value of 120 seconds, then set it as follows:
conf_http_HTTPTransport.io.timeout.millis=120000
- Ensure this file is owned by apigee:
chown apigee:apigee /opt/apigee/customer/application/message-processor.properties
- Restart the Message Processor:
/opt/apigee/apigee-service/bin/apigee-service edge-message-processor restart
- If you have more than one Message Processor, repeat the above steps on all the Message Processors.
Idea: Set the timeout value on the different components in the following order:Timeout on Client > Timeout on Router > Timeout on Message Processor > Timeout within API Proxy |
Slow API request processing by Edge
If Edge is very slow and/or taking a long time to process the API request, then you will get a
504 Gateway Timeout error.
Diagnosis
- Trace the affected API in Edge UI.
- Either wait for the error to occur or if you have the API call, then make some API calls
and reproduce the
504 Gateway Timeouterror. - Note, in this case, you may see a successful response in the Trace.
- The Router/client times out as the Message Processor does not respond back within the specified timeout period on the Router/client (whichever has the lowest time out period). However, the Message Processor continues to process the request and may complete successfully.
- In addition, the
HTTPTransport.io.timeout.millisvalue set on the Message Processor triggers only if the Message Processor communicates with a HTTP/HTTPS backend server. In other words, this timeout will not get triggered when any policy (other than ServiceCallout policy) within API Proxy is taking a long time.
- After the error has occurred, examine the specific request that has the longest elapsed time.
- Check the elapsed time at each phase and make a note of the phase where the most time is spent.
- If you observe the longest elapsed time in any of the policies other than the Service Callout policy, then that indicates that Edge is taking a long time to process the request.
- Here's a sample UI trace showing very high elapsed time on JavaScript Policy:
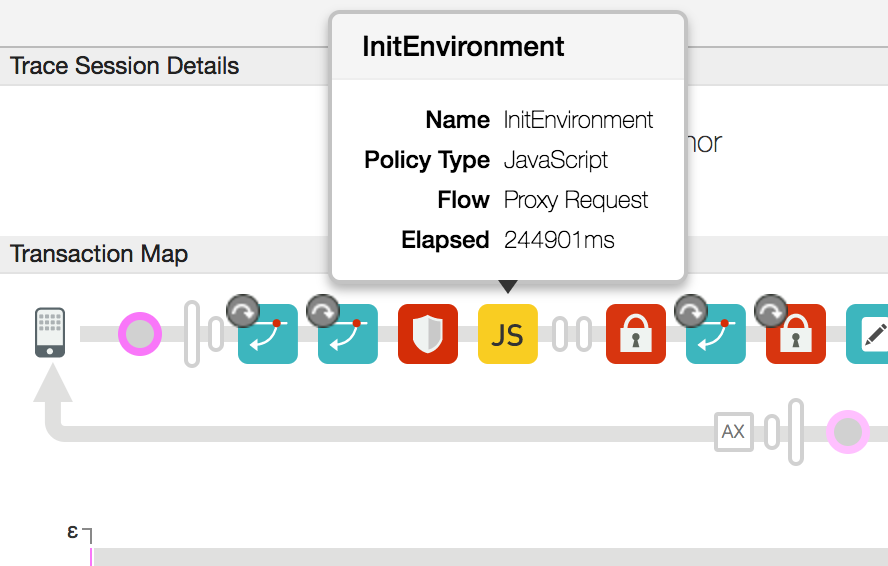
- In the above example, you notice that the JavaScript policy takes an abnormally long amount of time of ~ 245 seconds.
Resolution
- Check if the policy that took a long time to respond and if there is any custom code that might require a long time to process. If there is any such code, then see if you can fix/optimize the identified code.
- If there is no custom code that might cause high processing time, then check if the Message
Processors are experiencing high CPU or memory usage:
- If any Message Processor is experiencing high CPU usage, then generate three
thread
dumps every 30 seconds using the following command:
JAVA_HOME/bin/jstack -l PID > FILENAME
- If any Message Processor is having high Memory usage, then generate a
heap dump
using the following command:
sudo -u apigee JAVA_HOME/bin/jmap -dump:live,format=b,file=FILENAME PID
- Restart the Message Processor using the below command. This should bring down the CPU
and Memory.
/opt/apigee/apigee-service/bin/apigee-service edge-message-processor restart
- Monitor the API calls and confirm if the problem still exists.
- Contact Apigee Edge Support and provide the thread
dumps, heap dump, and Message Processor logs
(
/opt/apigee/var/log/edge-message-processor/logs/system.log)to help them investigate the cause for the high CPU/memory usage.
- If any Message Processor is experiencing high CPU usage, then generate three
thread
dumps every 30 seconds using the following command:
Diagnose issues using API Monitoring
API Monitoring enables you to isolate problem areas quickly to diagnose error, performance, and latency issues and their source, such as developer apps, API proxies, backend targets, or the API platform.
Step through a sample scenario that demonstrates how to troubleshoot 5xx issues with your APIs using API Monitoring. For example, you may want to set up an alert to be notified when the number of 504 status codes exceeds a particular threshold.