
You're viewing Apigee Edge documentation.
Go to the
Apigee X documentation. info
Videos
| Video | Description |
|---|---|
| 500 Internal Server Error - caused by backend | Demonstrates a real-time 500 Internal Server Error caused by the backend server along with steps to troubleshoot and resolve the error. |
Symptom
The client application gets an HTTP status code of 500 with the message
Internal Server Error as a response for API calls.
The HTTP status code 500 is a generic error response. It means that the server
encountered an unexpected condition that prevented it from fulfilling the request. This error is
usually returned by the server when no other error code is suitable.
Error messages
Client application gets the following response code:
HTTP/1.1 500 Internal Server Error
In addition, you may observe an error message similar to the one shown below:
Sample #1
Sample Backend Server Response #1
{"errorMessage":"Sorry either your e-mail or password didn't match.",
"errorParameters":"{}",
"errorCode":"500",
"errorKey":"INVALID_EMAILPASSWORD"}
Sample #2
Sample Backend Server Response #2
<Envelope xmlns:s="http://schemas.xmlsoap.org/soap/envelope/">
   <Body>
      <Error>
         <code>500</code>
         <message xml:lang="en-US">Not Authorised(e4138fa0-ec57).</message>
      </Error>
   </Body>
</Envelope>
Possible causes
The 500 Internal Server Error could be returned by the backend server due to a
number of causes. This playbook explains how to troubleshoot using common steps and resolve this
error irrespective of its cause.
The possible causes for this issue are as follows:
| Cause | Description | Troubleshooting instructions applicable for |
|---|---|---|
| Error in backend server | The backend server may fail for some reason. | Edge Private and Public Cloud users |
Common diagnosis steps
Use one of the following tools/techniques to diagnose this error:
API Monitoring
Procedure #1: Using API Monitoring
To diagnose the error using API Monitoring:
- Sign in to Apigee Edge UI as a user with an appropriate role.
Switch to the organization in which you want to investigate the issue.

- Navigate to the Analyze > API Monitoring > Investigate page.
- Select the specific timeframe in which you observed the errors.
Plot Fault Code against Time.
Select a cell which has the fault code
messaging.adaptors.http.flow.ErrorResponseCodeas shown below: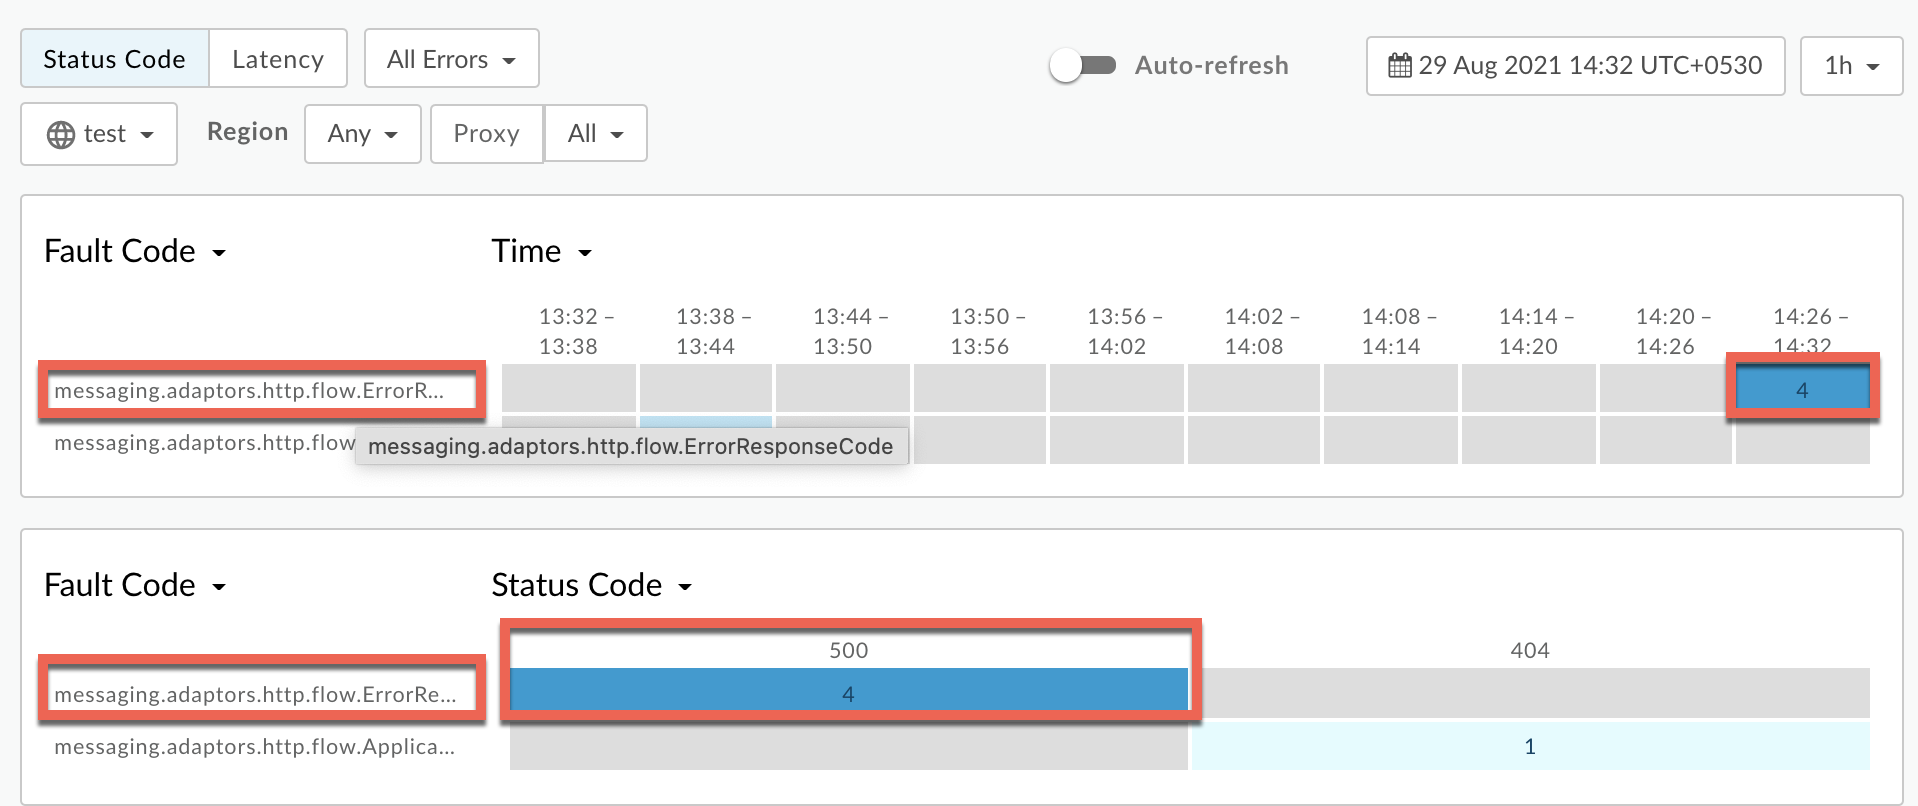
Information about the fault code
messaging.adaptors.http.flow.ErrorResponseCodeis displayed as shown below: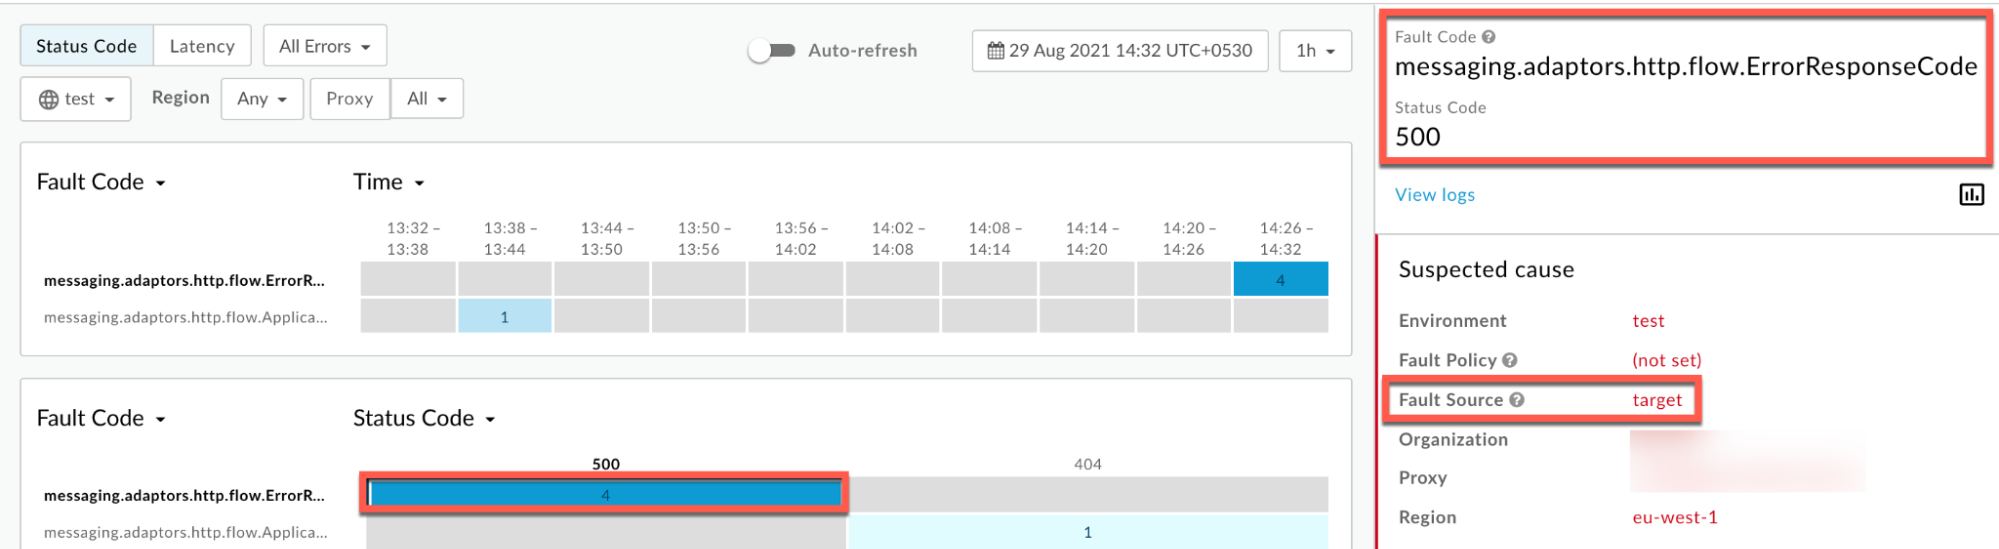
Click View logs and expand the row for the failed request.
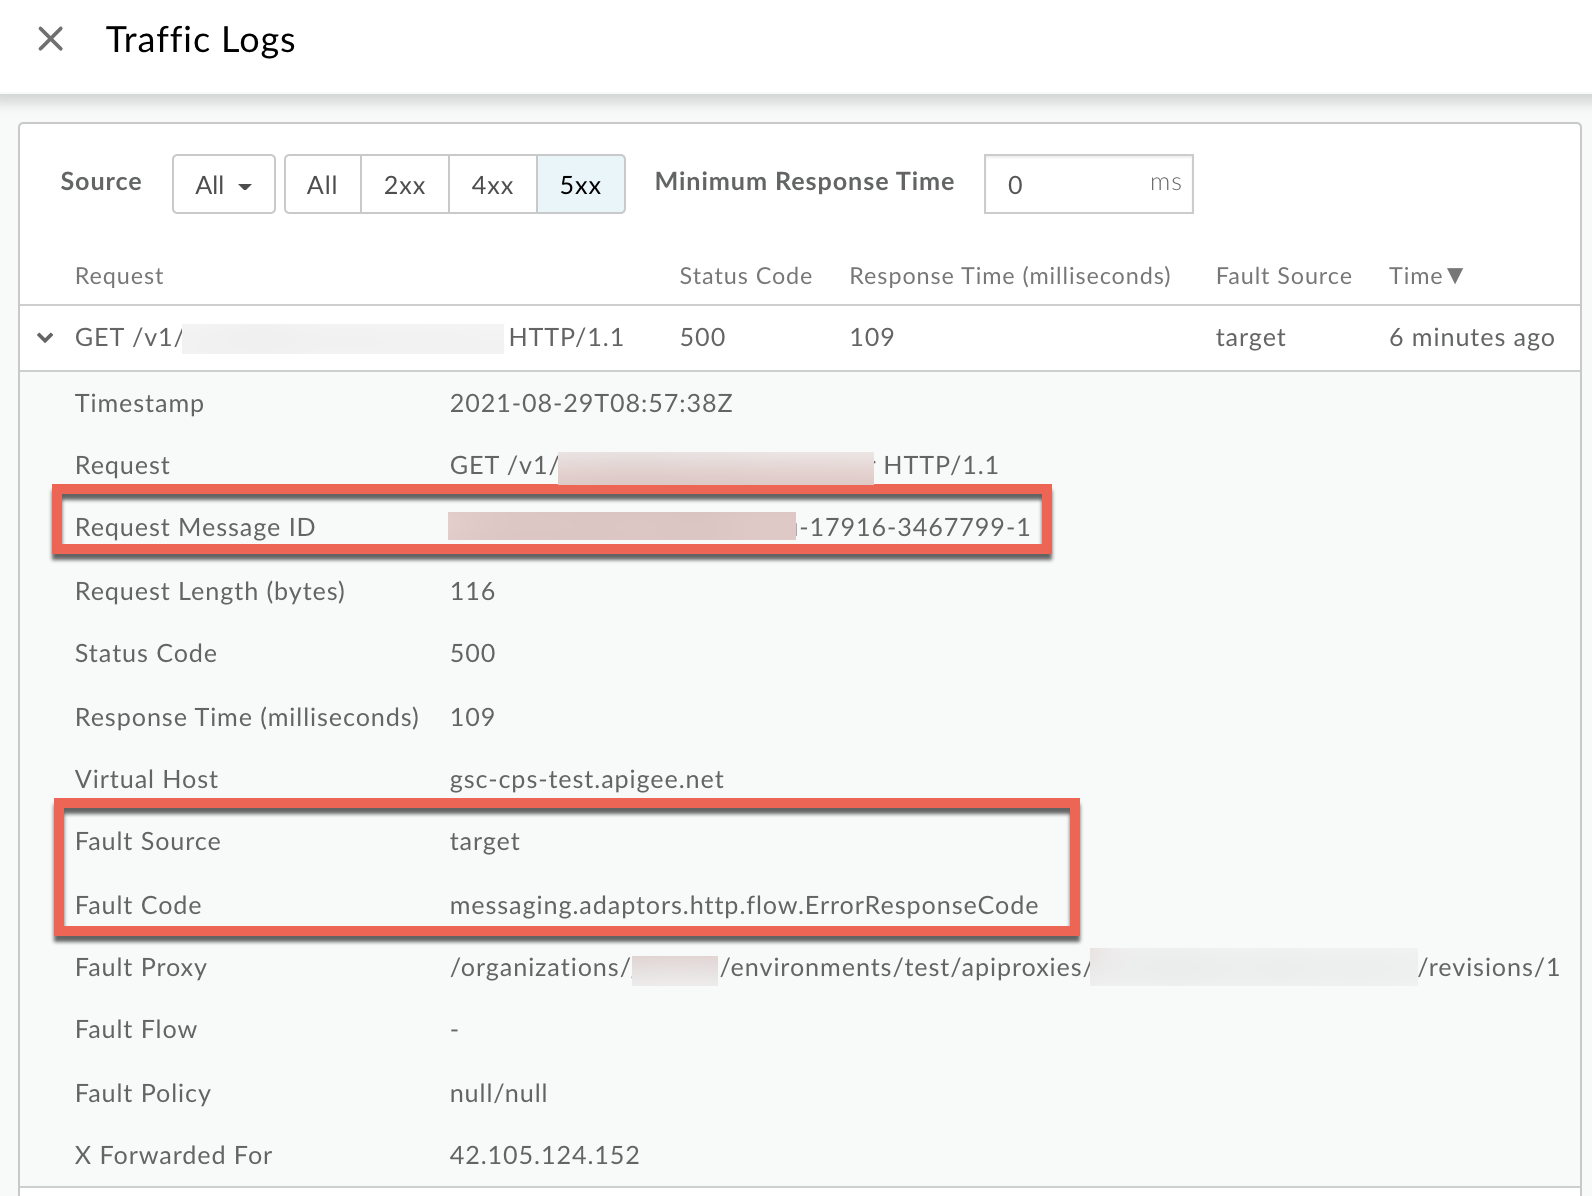
- From the Logs window, note the following details:
- Request Message ID
- Status Code:
500 - Fault Source:
target - Fault Code:
messaging.adaptors.http.flow.ErrorResponseCode
Trace
Procedure #2: Using Trace tool
To diagnose the error using the Trace tool:
- Enable the trace session and either
- Wait for the
500 Internal Server Errorerror with error codemessaging.adaptors.http.flow.ErrorResponseCodeto occur, or - If you can reproduce the issue, make the API call to reproduce the issue
500 Internal Server Error
- Wait for the
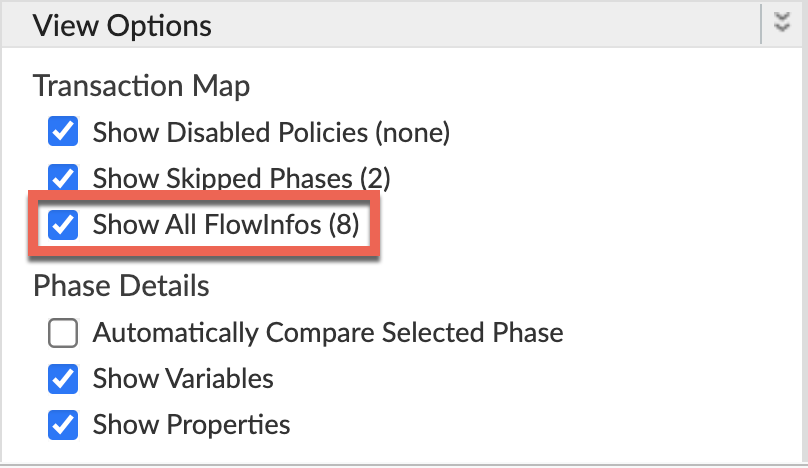
Ensure Show all FlowInfos is enabled:
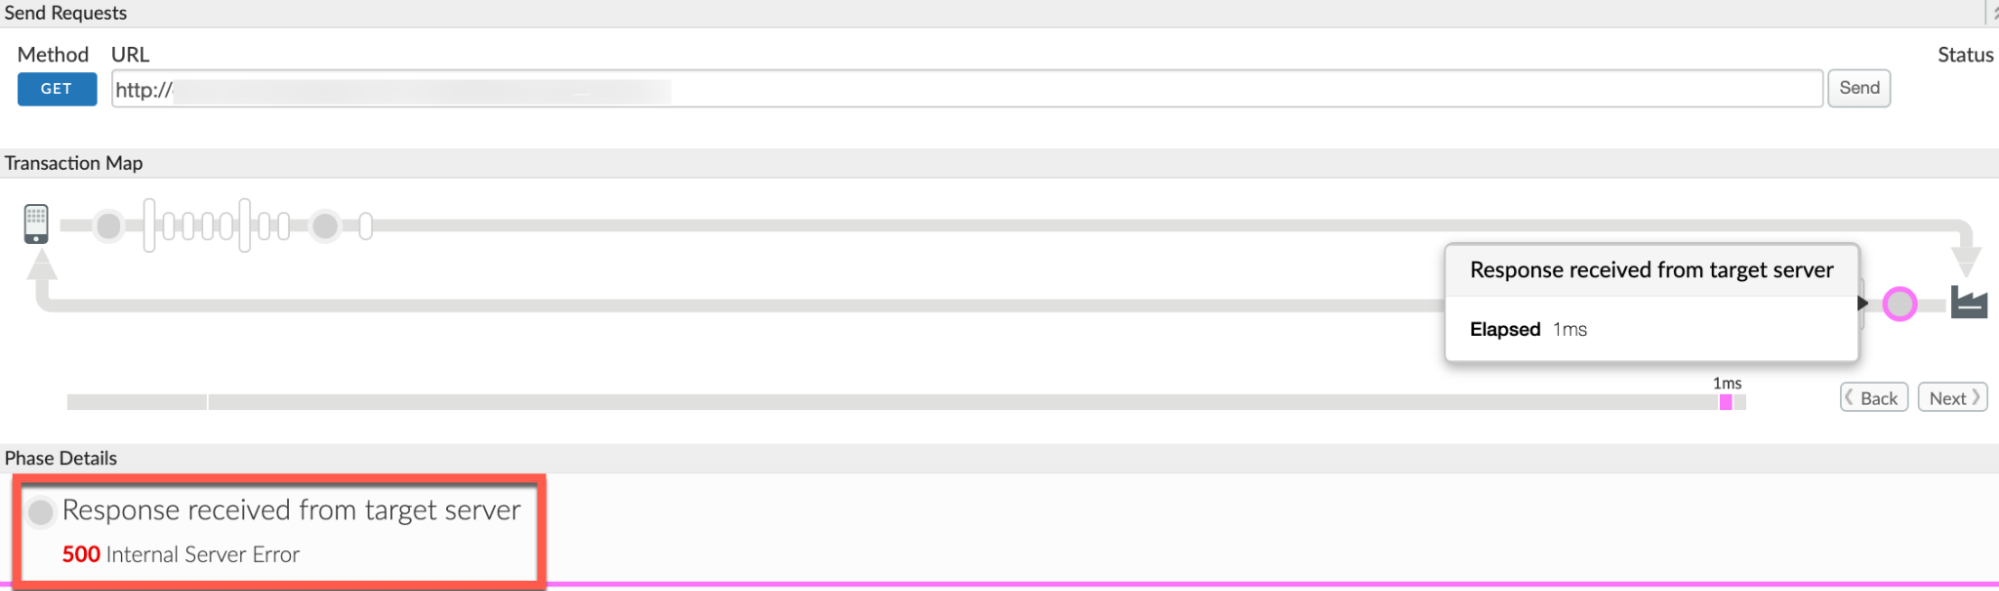
- Select one of the failing requests and examine the trace.
- Navigate through different phases of the trace and locate where the failure occurred.
You will find the error typically in a flow after the Response received from target server phase as shown below:
- Navigate to the AX (Analytics Data Recorded) Phase in the trace and click it.
Scroll down to the Phase Details Response Headers section and determine the values of X-Apigee-fault-code and X-Apigee-fault-source, and X-Apigee-Message-ID as shown below:
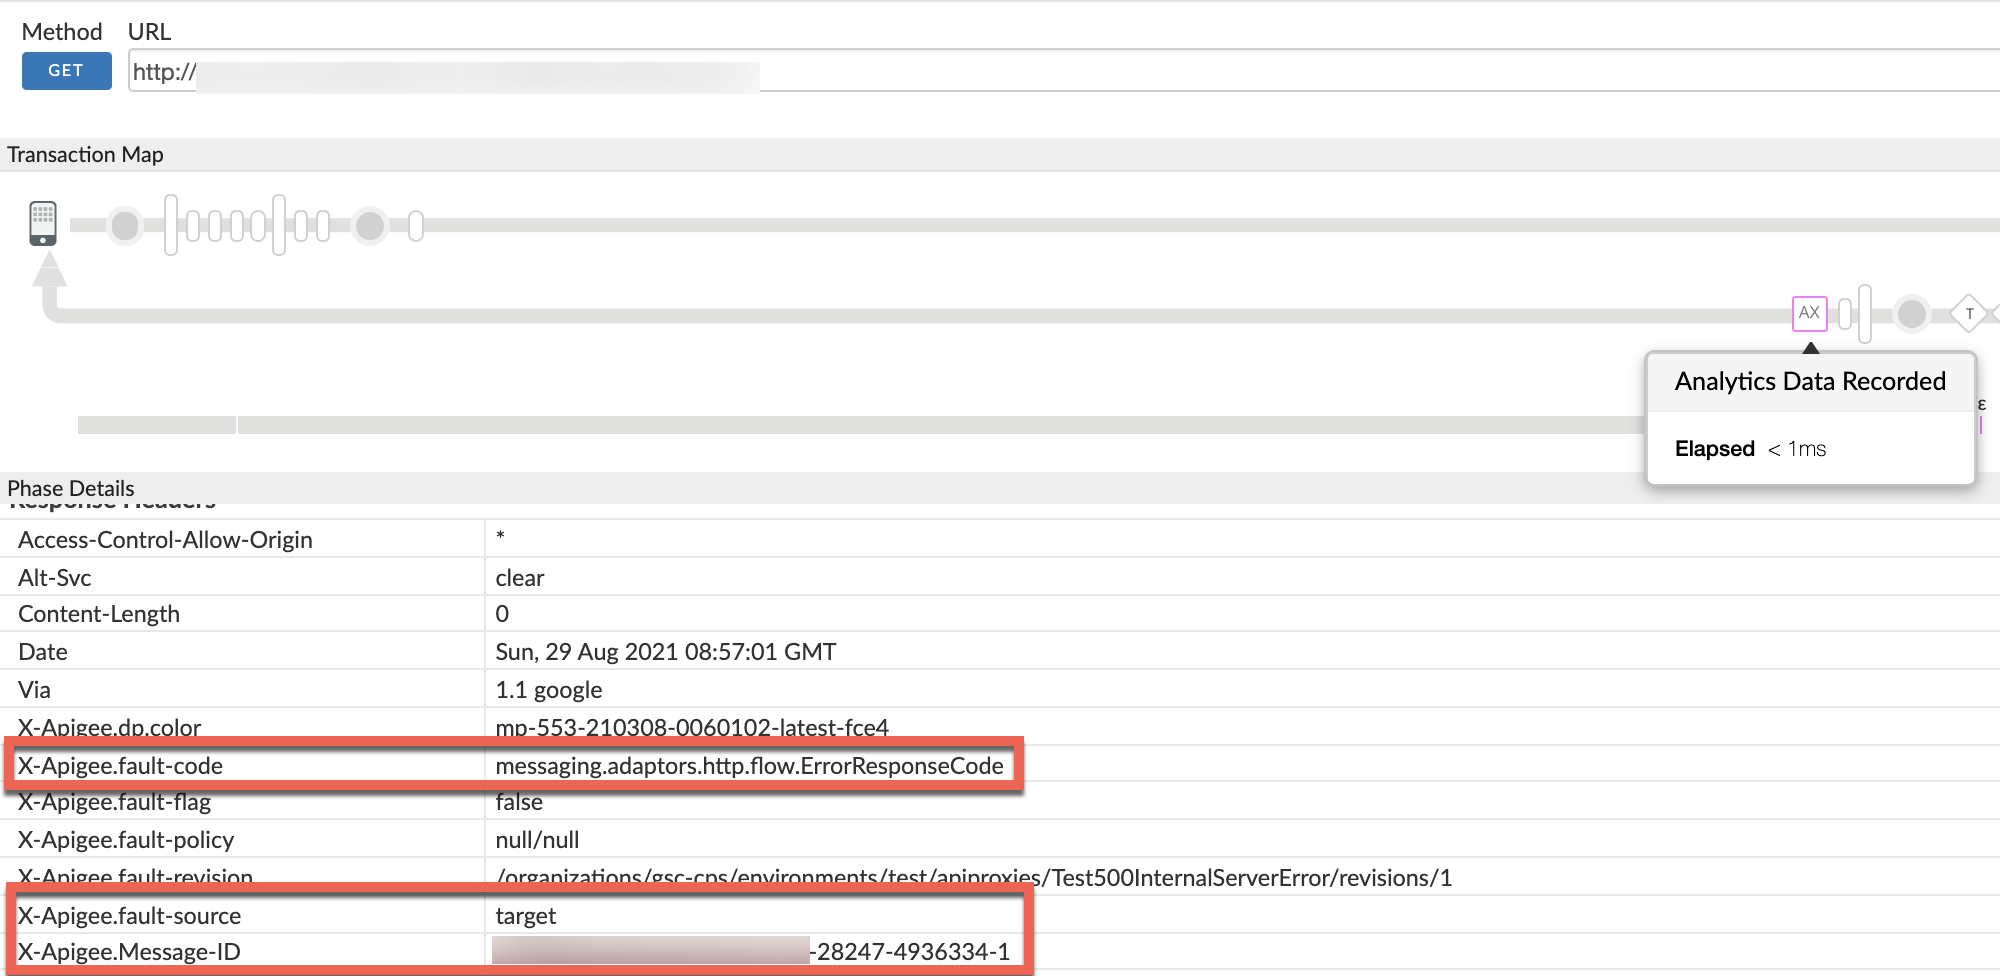
- Note the values of X-Apigee-fault-code, X-Apigee-fault-source, and X-Apigee-Message-ID:
| Response headers | Value |
|---|---|
| X-Apigee-fault-code | messaging.adaptors.http.flow.ErrorResponseCode |
| X-Apigee-fault-source | target |
| X-Apigee-Message-ID | MESSAGE_ID |
NGINX
Procedure #3: Using NGINX access logs
To diagnose the error using NGINX access logs:
- If you are a Private Cloud user, then you can use NGINX access logs to determine
the key information about HTTP
500 Internal Server Error. Check the NGINX access logs:
/opt/apigee/var/log/edge-router/nginx/ORG~ENV.PORT#_access_log- Search to see if there are any
500errors with error codemessaging.adaptors.http.flow.ErrorResponseCodeduring a specific duration (if the problem happened in the past) or if there are any requests still failing with500. If you do find any
500errors with the X-Apigee-fault-code matching the value ofmessaging.adaptors.http.flow.ErrorResponseCode, then determine the value of the X-Apigee-fault-source.Sample 500 error from NGINX access log:

The above sample entry from NGINX access log has the following values for X-Apigee-fault-code and X-Apigee-fault-source:
Headers Value X-Apigee-fault-code messaging.adaptors.http.flow.ErrorResponseCodeX-Apigee-fault-source target
Cause: Error in backend server
Diagnosis
The 500 Internal Server Error responded by the backend server can be
caused by a number of reasons. You will need to diagnose each situation independently.
- Determine the Fault Code, Fault Source for the error observed using API Monitoring, Trace tool, or NGINX access logs as explained in Common diagnosis steps.
- If the Fault Source is
targetand Fault Code ismessaging.adaptors.http.flow.ErrorResponseCode, then that indicates that the error is returned by the backend server. - You can use one of the following steps to diagnose the cause of the issue:
Trace
Using Trace:
If you have a Trace session for the failure, then perform the following steps:
- In the Trace, select the API request that has failed with
500 Internal Server Error. Select the Response received from target server phase from the failing API request as shown in the figure below:
Scroll down to the Phase Details section and check the Response Content, which contains the response from the backend server.
Sample Response Content:
<Envelope xmlns:s="http://schemas.xmlsoap.org/soap/envelope/">
   <Body>
      <Error>
         <code>500</code>
         <message xml:lang="en-US">Not Authorised(e4138fa0-ec57).</message>
      </Error>
   </Body>
</Envelope>
In the above response, note that the error message from the backend server is Not Authorised. This indicates that the user may have passed invalid credentials and that is why they are getting this error.
Call backend server
Making direct call to backend server:
You can make a direct call to the backend server and:
- Validate if you are getting the same
500 Internal Server Errorresponse as received when the request was made through Apigee Edge - Check the error message (response) received from the backend server
Perform the following steps to make the direct call to the backend server:
- Ensure that you have all the required headers, query parameters, and any credentials that need to be passed to the backend server as part of the request.
- If the backend service is publicly accessible, then you can use the
curlcommand, Postman, or any other REST Client and invoke the backend server API directly. If the backend server is accessible only from the Message Processors, then you can use the
curlcommand, Postman, or any other REST Client and invoke the backend server API directly from the Message Processor.- Validate if the backend service is indeed returning
500 Internal Server Errorand check the error message (response) returned by the backend server and determine the cause for this error.
Backend server logs
Using backend server logs
- Review the backend server logs and try to get more details about the error and its cause.
- If possible, enable the debug mode on the backend server to get more details about the error and the cause.
- In the Trace, select the API request that has failed with
Check to see if you are using proxy chaining in the specific target endpoint of the failing API Proxy; that is, if the target server/target endpoint is invoking another proxy in Apigee Edge. To determine this:
If you have the trace for the failing request, navigate to the Request sent to target server phase and click Show Curl.
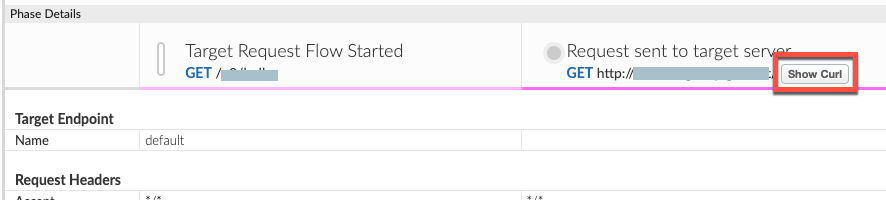
- The Curl for Request Sent to Target Server window opens from which you can determine the target server host alias.
- Review the target endpoint of your API Proxy and check if the backend server URL or the host name in the target server points to another Proxy or your own backend server.
- If the target server host alias is pointing to a virtual host alias, then it
is proxy chaining. In this case, you need to repeat all the above steps for the
chained proxy until you determine what is actually causing the
500 Internal Server Error. In these cases500 Internal Server Errormay happen in other chained proxies at other stages as well which can be diagnosed and resolved using the instructions given in this playbook or in the 500 Internal Server Error playbook. - If the target server host alias points to your backend server, then go to Resolution.
Resolution
If it is ascertained that the 500 error is coming from the backend server, then
work with your backend server team to fix the issue appropriately.
In the example discussed above, you may have to request the users pass valid credentials to fix this issue.
Key points to note
- The actual error message returned by the backend server for
500 Internal Server Errorcan be viewed only if you have captured the trace session for the failing requests. - The backend server response will not be logged in API Monitoring, NGINX Access Logs, or Message Processor logs for security reasons.
- You can review the backend server logs or enable debug mode on the backend to get more
details about the
500 Internal Server Errorand/or view the error message returned by the backend server.
Must gather diagnostic information
If the problem persists even after following the above instructions, gather the following diagnostic information and contact Apigee Edge Support.
If you are a Public Cloud user, provide the following information:
- Organization name
- Environment name
- API Proxy name
- Complete
curlcommand to reproduce the500error - Trace file containing the requests with
500 Internal Server Error - If the
500errors are not occurring currently then provide the time period with the timezone information when500errors occurred in the past.
If you are a Private Cloud user, provide the following information:
- Complete error message observed for the failing requests
- Organization, environment name, and API proxy name for which you are observing
500errors - API proxy bundle
- Trace file containing the requests with
500 Internal Server Error - NGINX access logs
/opt/apigee/var/log/edge-router/nginx/ORG~ENV.PORT#_access_logWhere: ORG, ENV, and PORT# are replaced with actual values.
- Message Processor system logs
/opt/apigee/var/log/edge-message-processor/logs/system.log - The time period with the timezone information when the
500errors occurred.