
You're viewing Apigee Edge documentation.
Go to the
Apigee X documentation. info
Symptom
The analytics dashboards (Proxy Performance, Target Performance, etc.) are not showing any data in the Edge UI. All the dashboards show the following message:
No traffic in the selected date range
Error messages
This issue does not result in observable errors.
Possible causes
The following table lists possible causes of this issue:
| Cause | For |
|---|---|
| No API Traffic for Organization-Environment | Edge for Private Cloud users |
| Data available in Postgres Database, but not displaying in UI | Edge for Private Cloud users |
| Analytics Data not being pushed to Postgres Database | Edge for Private Cloud users |
| Incorrect Analytics Deployment | Edge for Private Cloud users |
| Stale Analytics Server UUIDs | Edge for Private Cloud users |
No API Traffic for Organization-Environment
Diagnosis
- Check if there is traffic for the API Proxies on the specific organization-environment for
the specific duration that you are trying to view the analytics data using one of the following
methods:
- Enable the trace for any of your APIs that is currently being used by your users and check if you are able to get any requests in the trace.
- View the NGINX access logs
(
/opt/apigee/var/log/edge-router/nginx/logs/access.log)and see if there any new entries for API Proxies for the specific duration. - If you log information from API Proxies to a log server such as Syslog, Splunk, Loggly, etc., then you can check if there are any entries in these log servers for API Proxies for the specific duration.
- If there's no traffic (no API requests) for the specific duration, then analytics data is not available. You will see "No traffic in the selected date range" in the analytics dashboard.
Resolution
- Make some calls to one or more API proxies in the specific organization-environment.
- Wait for a few seconds, and then view the analytics dashboards in the Hour tab and see if the data appears.
- If the issue persists, then proceed to Data available in Postgres Database, but not displaying in UI.
Data available in Postgres Database, but not displaying in UI
Symptom
First, determine the availability of latest Analytics data in Postgres database.
To check if the latest Analytics data is available in the Postgres Master node:
- Log in to each of the Postgres servers and run the following command to validate if you are
on the Master Postgres node:
/opt/apigee/apigee-service/bin/apigee-service apigee-postgresql postgres-check-master
- On the Master Postgres node, log in to PostgreSQL:
psql -h /opt/apigee/var/run/apigee-postgresql -U apigee apigee
- Check if the table exists for your org-env using the following SQL query in the Postgres
database:
\d analytics."orgname.envname.fact"
- Check if the latest data is available in the Postgres database using the following SQL
query:
select max(client_received_start_timestamp) from analytics."orgname.envname.fact";
- If the latest timestamp is very old (or null), then this indicates that data is not available in the Postgres database. The likely cause for this issue would be that the data is not pushed from the Qpid Server to the Postgres database. Proceed to Analytics Data not being pushed to Postgres Database.
- If the latest data is available in the Postgres database on the Master node, then follow the below steps to diagnose why the data is not displaying in the Edge UI.
Diagnosis
- Enable Developer Tools
in your Chrome browser and get the API used from one of the analytics dashboards using the
below steps:
- Select the Network tab from the Developer Tools.
- Start Recording.
- Reload the Analytics dashboard.
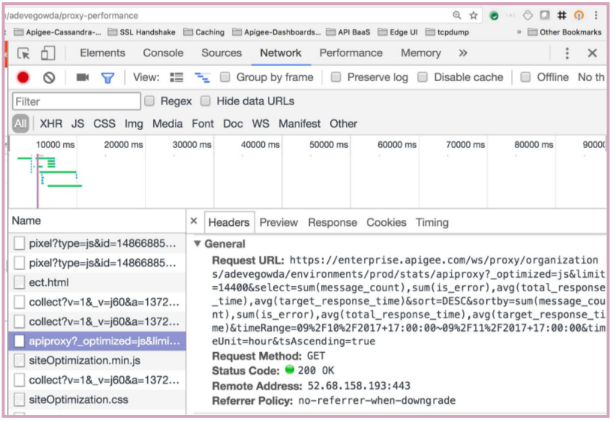
- On the left hand panel in the Developer Tools, select the row having "apiproxy?_optimized...".
- On the right hand panel in the Developer Tools, select the "Headers" tab and note the "Request URL".
- Here's sample output from the Developer Tools:
Sample output showing the API used in Proxy Performance dashboard from Network Tab of Developer Tools for Proxy Performance dashboard
- Run the management API call directly and check if you get the results. Here's a sample API
call for the Day tab in the Proxy Performance dashboard:
curl -u username:password
  "http://management_server_IP_address:8080/v1/organizations/
  org_name/environments/env_name/stats/apiproxy?limit=14400&
  select=sum(message_count),sum(is_error),avg(total_response_time),
  avg(target_response_time)&sort=DESC&sortby=sum(message_count),sum(is_error),
  avg(total_response_time),avg(target_response_time)&timeRange=08%2F9%2F2017+
  18:00:00~08%2F10%2F2017+18:00:00&timeUnit=hour&tsAscending=true"
- If you see a successful response but without any data, then it indicates that the Management Server is unable to fetch the data from the Postgres server due to network connectivity issues.
- Check if you are able to connect to the Postgres server from the Management Server:
telnet Postgres_server_IP_address 5432
- If you are unable to connect to the Postgres server, check if there are any firewall restrictions on port 5432.
- If there are firewall restrictions, then that could be the cause for the Management Server being unable to pull the data from the Postgres server.
Resolution
- If there are firewall restrictions, then remove them so that the Management Server can communicate with the Postgres server.
- If there are no firewall restrictions, then this issue could be due to network glitch.
- If there was any network glitch on the Management Server, then restarting it might fix the issue.
- Restart all the Management Servers one by one using the below command:
/opt/apigee/apigee-service/bin/apigee-service edge-management-server restart
- Check if you are able to see the analytics data in the Edge UI.
If you still don't see the data, contact Apigee Edge Support.
Analytics Data not being pushed to Postgres Database
Diagnosis
If the data is not pushed from Qpid Server to Postgres Database as determined in Data available in Postgres Database, but not shown up in UI, then perform the following steps:
- Check if each of the Qpid Server is up and running by executing the below command:
/opt/apigee/apigee-service/bin edge-qpid-server status
- If any Qpid Server is down, then restart it. If not, jump to step #5.
/opt/apigee/apigee-service/bin edge-qpid-server restart
- Wait for some time and then re-check if the latest data is available in Postgres database.
- Log in to PostgreSQL:
psql -h /opt/apigee/var/run/apigee-postgresql -U apigee apigee
- Run the below SQL query to check if the latest data is available:
select max(client_received_start_timestamp) from analytics."orgname.envname.fact";
- Log in to PostgreSQL:
- If the latest data is available, then skip the following steps and proceed to last step in Resolution section. If the latest data is not available, then proceed with the following steps.
- Check if the messages from Qpid server queues are being pushed to Postgres database.
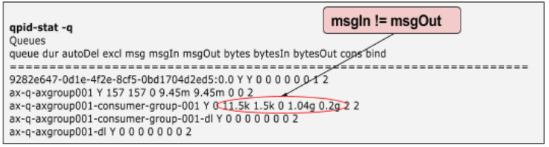
- Execute the
qpid-stat -q commandand check the msgIn and msgOut column values. - Here's a sample output that shows the msgIn and msgOut are not equal. This indicates
that messages are not being pushed from Qpid Server to Postgres Database.
- Execute the
- If there's a mismatch in msgIn and msgOut columns, then check the Qpid
Server logs
/opt/apigee/var/log/edge-qpid-server/system.logand see if there are any errors. - You may see error messages such as "Probably PG is still down" or
"FATAL: sorry, too many clients already" as shown in the figure below:
2017-07-28 09:56:39,896 ax-q-axgroup001-persistpool-thread-3
  WARN c.a.a.d.c.ServerHandle - ServerHandle.logRetry() : Found the exception to be
  retriable - . Error observed while trying to connect to
  jdbc:postgresql://PG_IP_address:5432/apigee Initial referenced UUID when
  execution started in this thread was a1ddf72f-ac77-49c0-a1fc-d0db6bf9991d
  Probably PG is still down. PG set used - [a1ddf72f-ac77-49c0-a1fc-d0db6bf9991d]
2017-07-28 09:56:39,896 ax-q-axgroup001-persistpool-thread-3
  WARN c.a.a.d.c.ServerHandle - ServerHandle.logRetry() : Could not get JDBC Connection;
  nested exception is org.postgresql.util.PSQLException: FATAL: sorry, too many clients already
2017-07-28 09:56:53,617 pool-7-thread-1
  WARN c.a.a.d.c.ServerHandle - ServerHandle.logRetry() : Found the exception to be
  retriable - . Error observed while trying to connect to
  jdbc:postgresql://PG_IP_address:5432/apigee
  Initial referenced UUID when execution started in this thread was
  a1ddf72f-ac77-49c0-a1fc-d0db6bf9991d Probably PG is still down. PG set used -
  [a1ddf72f-ac77-49c0-a1fc-d0db6bf9991d]
2017-07-28 09:56:53,617 pool-7-thread-1
  WARN c.a.a.d.c.ServerHandle - ServerHandle.logRetry() : Could not get JDBC Connection;
  nested exception is org.apache.commons.dbcp.SQLNestedException: Cannot create
  PoolableConnectionFactory (FATAL: sorry, too many clients already)
This could happen if the Postgres Server is running too many SQL queries or the CPU running high and hence unable to respond to Qpid Server.
Resolution
- Restart the Postgres Server and PostgreSQL as shown below:
/opt/apigee/bin/apigee-service edge-postgres-server restart
/opt/apigee/bin/apigee-service apigee-postgresql restart
- This restart ensures that all the previous SQL queries are stopped and should allow new connections to the Postgres database.
- Reload the Analytics dashboards and check if the Analytics data is being displayed.
If the problem persists, contact Apigee Edge Support.
Incorrect Analytics Deployment
Diagnosis
- Get the analytics deployment status by using the following API call:
curl -u user_email:password http://management_server_host:port
/v1/organizations/orgname/environments/envname/provisioning/axstatus
- Check the status of the Qpid and Postgres servers from the results of the API call.
- If the status of Qpid and Postgres servers are shown as "SUCCESS", then it indicates the analytics servers are wired properly. Proceed to Stale Analytics Server UUIDs.
- If the status of Qpid/Postgres servers is shown as "UNKNOWN" or "FAILURE", then it
indicates an issue with the corresponding server.
For example, the following scenario shows the status of the Postgres servers as "UNKNOWN":
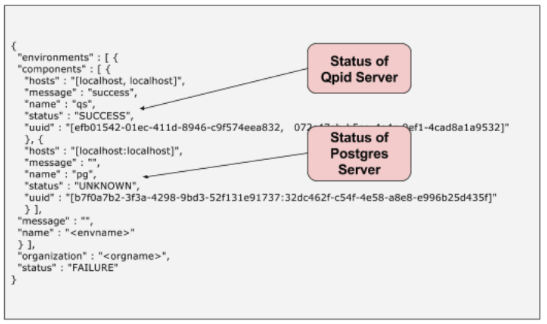
This may happen if there is a failure during the onboarding of analytics. This failure prevents the messages from Management Servers reaching the Postgres servers.
Resolution
This issue can be typically resolved by restarting the servers which showed the "FAILURE" or "UNKNOWN".
- Restart each of the servers whose analytics wiring status indicated "FAILURE" or "UNKNOWN"
using the following command:
/opt/apigee/apigee-service/bin/apigee-service component restart
- For example:
- If you see the issue on Qpid Servers, then restart the Qpid Servers:
/opt/apigee/apigee-service/bin/apigee-service edge-qpid-server restart
- If you see the issue on Postgres Servers, then restart both the Master and Slave
Postgres Server nodes:
/opt/apigee/apigee-service/bin/apigee-service edge-postgres-server restart
- If you see the issue on Qpid Servers, then restart the Qpid Servers:
- In the example above, the "UNKNOWN" message is shown for the Postgres servers, so you need
to restart both the Master and Slave Postgres servers:
/opt/apigee/apigee-service/bin/apigee-service edge-postgres-server restart
Stale Analytics Server UUIDs
Diagnosis
- Get the analytics configuration using the following API call:
curl -u user_email:password http://management-server-host:port/v1/analytics/groups/ax
Here's a sample output from the above API:
[ {
  "name" : "axgroup001",
  "properties" : {
    "consumer-type" : "ax"
  },
  "scopes" : [ "myorg~prod", "myorg~test" ],
  "uuids" : {
    "aries-datastore" : [ ],
    "postgres-server" : [ "6777...2db14" ],
    "dw-server" : [ ],
    "qpid-server" : [ "774e...fb23", "29f3...8c11" ]
  },
  "consumer-groups" : [ {
    "name" : "consumer-group-001",
    "consumers" : [ "774e...8c11" ],
    "datastores" : [ "6777...db14" ],
    "properties" : {
    }
  } ],
  "data-processors" : {
  }
} ]
- Ensure the following information in the output is correct:
- org-env names listed in the "scopes" element.
- UUIDs of the Postgres servers and Qpid servers.
- Get the Postgres Server UUIDs by running the following command on each of the
Postgres server nodes:
curl 0:8084/v1/servers/self/uuid
- Get the Qpid Server UUIDs by running the following command on each of the Qpid
server nodes:
curl 0:8083/v1/servers/self/uuid
- Get the Postgres Server UUIDs by running the following command on each of the
Postgres server nodes:
- If all the information is correct, then proceed to Analytics Data not being pushed to Postgres Database.
- If the UUIDs of Postgres and/or Qpid servers are incorrect, then it could be possible that the Management Servers are referring to stale UUIDs.
Resolution
To remove the stale UUIDs and add the correct UUIDs of the servers, contact Apigee Edge Support.