
You're viewing Apigee Edge documentation.
Go to the
Apigee X documentation. info
Symptom
The client application gets an HTTP response status 503 with the message
Service Unavailable following an API proxy call.
Error message
The client application gets the following response code:
HTTP/1.1 503 Service Unavailable
In addition, you may observe the following error message:
{
   "fault": {
      "faultstring": "The Service is temporarily unavailable",
      "detail": {
           "errorcode": "messaging.adaptors.http.flow.ServiceUnavailable"
       }
    }
}
Possible Causes
| Cause | Description | Troubleshooting instructions applicable for |
|---|---|---|
| Target server prematurely closes connection | The target server prematurely ends the connection while the Message Processor is still sending the request payload. | Edge Public and Private Cloud users |
Common diagnosis steps
Determine the Message ID of the failing request
Trace tool
To determine the message ID of the failing request using the Trace tool:
- If the issue is still active, enable the trace session for the affected API.
- Make the API call and reproduce the issue -
503 Service Unavailablewith error codemessaging.adaptors.http.flow.ServiceUnavailable. - Select one of the failing requests.
- Navigate to the AX phase, and determine the message ID
(
X-Apigee.Message-ID) of the request by scrolling down in the Phase Details section as shown in the following figure.
NGINX access logs
To determine the message ID of the failing request using the NGINX access logs:
You can also refer to NGINX Access logs to determine the message ID for the 503 errors.
This is particularly useful if the issue has occurred in the past or if the issue is intermittent
and you are unable to capture the trace in the UI. Use the following steps to determine this information from NGINX access logs:
- Check the NGINX access logs: (
/opt/apigee/var/log/edge-router/nginx/ORG~ENV.PORT#_access_log) - Search to see if there are any
503Errors for the specific API proxy during a specific duration (if the problem happened in the past) or if there are any requests still failing with503. - If there are any
503Errors with X-Apigee-fault-code messaging.adaptors.http.flow.ServiceUnavailable, note the message ID for one or more such requests as shown in the following example:Sample Entry showing the
503Error
Cause: Target server prematurely closes connection
Diagnosis
- If you are a Public Cloud or Private Cloud user:
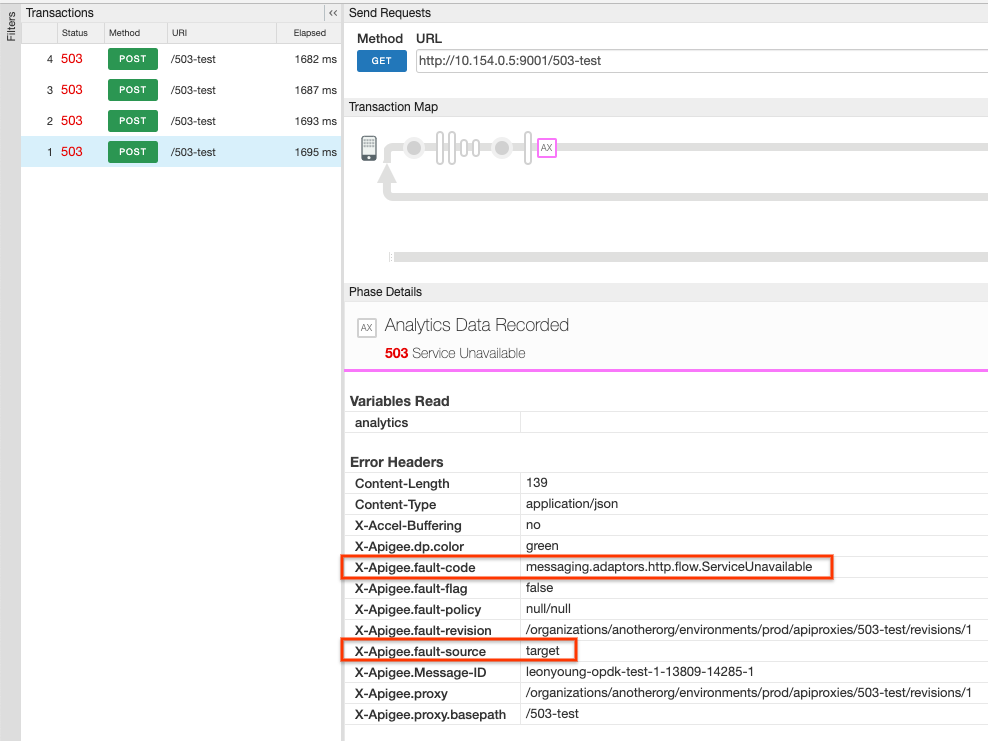
- Use the Trace tool (as explained in Common diagnosis steps)
and verify that you have both of the following set in the Analytics Data Recorded pane:
- X-Apigee.fault-code:
messaging.adaptors.http.flow.ServiceUnavailable - X-Apigee.fault-source:
target
- X-Apigee.fault-code:
- Use the Trace tool (as explained in Common diagnosis steps)
and verify that you have both of the following set in the Error pane immediately after
the
TARGET_REQ_FLOWstate property:- error.class:
com.apigee.errors.http.server.ServiceUnavailableException - error.cause:
Broken pipe
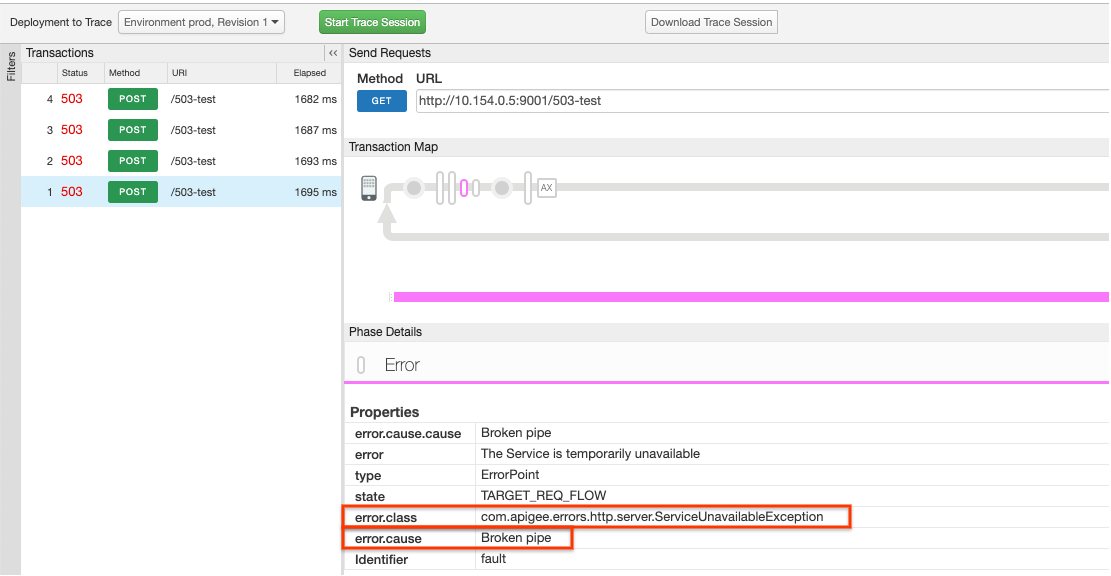
- error.class:
- Go to Using tcpdump for further investigation.
- Use the Trace tool (as explained in Common diagnosis steps)
and verify that you have both of the following set in the Analytics Data Recorded pane:
- If you are a Private Cloud user:
- Determine the message ID of the failing request.
- Search for the message ID in the Message Processor log
(
/opt/apigee/var/log/edge-message-processor/logs/system.log). - You will see one of the following exceptions:
Exception #1: java.io.IOException: Broken pipe occurred while writing to channel ClientOutputChannel
2021-01-30 15:31:14,693 org:anotherorg env:prod api:myproxy
rev:1 messageid:myorg-opdk-test-1-30312-13747-1  NIOThread@1
INFO  HTTP.SERVICE - ExceptionHandler.handleException() :
Exception java.io.IOException: Broken pipe occurred while writing to channel
ClientOutputChannel(ClientChannel[Connected:
Remote:IP:PORT Local:0.0.0.0:42828]@8380 useCount=1
bytesRead=0 bytesWritten=76295 age=2012ms  lastIO=2ms  isOpen=false)
or
Exception #2: onExceptionWrite exception: {}
java.io.IOException: Broken pipe2021-01-31 15:29:37,438 org:anotherorg env:prod api:503-test rev:1 messageid:leonyoung-opdk-test-1-18604-13978-1 NIOThread@0 ERROR HTTP.CLIENT - HTTPClient$Context$2.onException() : ClientChannel[Connected: Remote:IP:PORT Local:0.0.0.0:57880]@8569 useCount=1 bytesRead=0 bytesWritten=76295 age=3180ms lastIO=2 ms isOpen=false.onExceptionWrite exception: {} java.io.IOException: Broken pipe
- Both of these exceptions indicate that while the Message Processor was still writing the
request payload to the backend server, the connection was prematurely closed by the
backend server. Hence, the Message Processor throws the exception
java.io.IOException: Broken pipe. - The
Remote:IP:PORTindicates the resolved backend server IP address and port number. - The attribute
bytesWritten=76295in the above error message indicates that the Message Processor had sent a payload of76295bytes to the backend server when the connection was closed prematurely. - The attribute
bytesRead=0indicates that the Message Processor has not received any data (response) from the backend server. - To investigate this issue further, gather a
tcpdumpeither on the backend server or Message Processor and analyze it as explained below.
Using tcpdump
-
Capture a
tcpdumpon either the backend server or the Message Processor with the following commands:Command to gather
tcpdumpon the backend server:tcpdump -i any -s 0 host MP_IP_ADDRESS -w FILE_NAME
Command to gather
tcpdumpon the Message Processor:tcpdump -i any -s 0 host BACKEND_HOSTNAME -w FILE_NAME
- Analyze the
tcpdumpcaptured:Sample tcpdump output (gathered on the Message Processor):
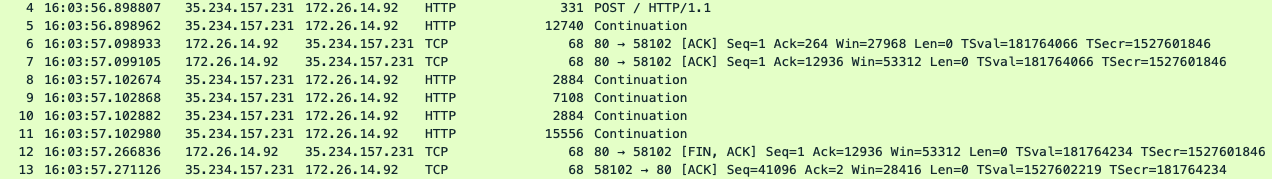
In the above
tcpdump, you can see the following:- In packet
4, the Message Processor sent aPOSTrequest to the backend server. - In packet
5,8,9,10,11, the Message Processor continued to send the request payload to the backend server. - In packet
6and7,the backend server responded withACKfor a part of the request payload received from the Message Processor. - However, in packet
12, instead of responding with anACKfor the received application data packets and subsequently responding with the response payload, the backend server instead responds with aFIN ACKinitiating the closure of the connection. - This clearly shows that the backend server is closing the connection prematurely while the Message Processor was still sending the request payload.
- This causes the Message Processor to record an
IOException: Broken Pipeerror and return a503to the client
- In packet
Resolution
- Work with either or both your application and networking teams to analyse and fix the issue with the premature disconnections on the backend server side.
- Ensure that the backend server application is not timing out or resetting the connection before receiving the entire request payload.
- If you have any intermediary networking device or layer between Apigee and backend server, then ensure that they are not timing out before the entire request payload is received.
If the problem still persists, go to Must gather diagnostic information.
Must gather diagnostic information
If the problem persists even after following the above instructions, gather the following diagnostic information and then contact Apigee Edge Support:
If you are a Public Cloud user, provide the following information:
- Organization name
- Environment name
- API Proxy name
- Complete
curlcommand to reproduce the503error - Trace file containing the request with the
503 Service Unavailableerror - If the
503errors are not occurring currently, provide the time period with the timezone information when503errors occurred in the past.
If you are a Private Cloud user, provide the following information:
- Complete error message observed for the failing requests
- Organization, Environment name and API Proxy name for which you are observing
503errors - API Proxy bundle
- Trace file containing the requests with
503 Service Unavailableerror - NGINX access logs
/opt/apigee/var/log/edge-router/nginx/ORG~ENV.PORT#_access_log - Message Processor logs
/opt/apigee/var/log/edge-message-processor/logs/system.log - The time period with the timezone information when the
503errors occurred Tcpdumpsgathered on the Message Processors and backend server when the error occurred