You're viewing Apigee Edge documentation.
Go to the
Apigee X documentation. info
Symptom
The client application receives an HTTP response status code 500 with the message Internal Server Error for API calls.
Error messages
The client applications may receive an error response as shown below:
HTTP/1.1 500 Internal Server Error
This may be followed by an error message something like this:
{
   "fault":{
      "faultstring":"Expecting } at line 1"
      "detail":{
         "errorcode":"Internal Server Error"
      }
   }
}

OR

{
   "fault":{
      "faultstring":"Expecting ] at line 1"
      "detail":{
         "errorcode":"Internal Server Error"
      }
   }
}Possible causes
The 500 Internal Server Error can occur due to a number of different causes. This playbook focuses on the 500 Internal Server Error caused due to accessing the request/response payload when streaming is enabled.
| Cause | Description | Who can perform the troubleshooting steps |
| Accessing Payload with Streaming Enabled | An error occurred because the request/response payload is accessed when streaming is enabled. | Edge Private and Public Cloud Users |
Cause: Accessing Payload with Streaming Enabled
Diagnosis
Procedure #1: Using Trace
- Enable the trace session, and make the API call to reproduce the issue - 500 Internal Server Error.
- Select one of the failing requests and examine the trace.
- Navigate through various phases of the trace and locate where the failure occurred.
- This error may have occurred while a policy is parsing the request/response payload.
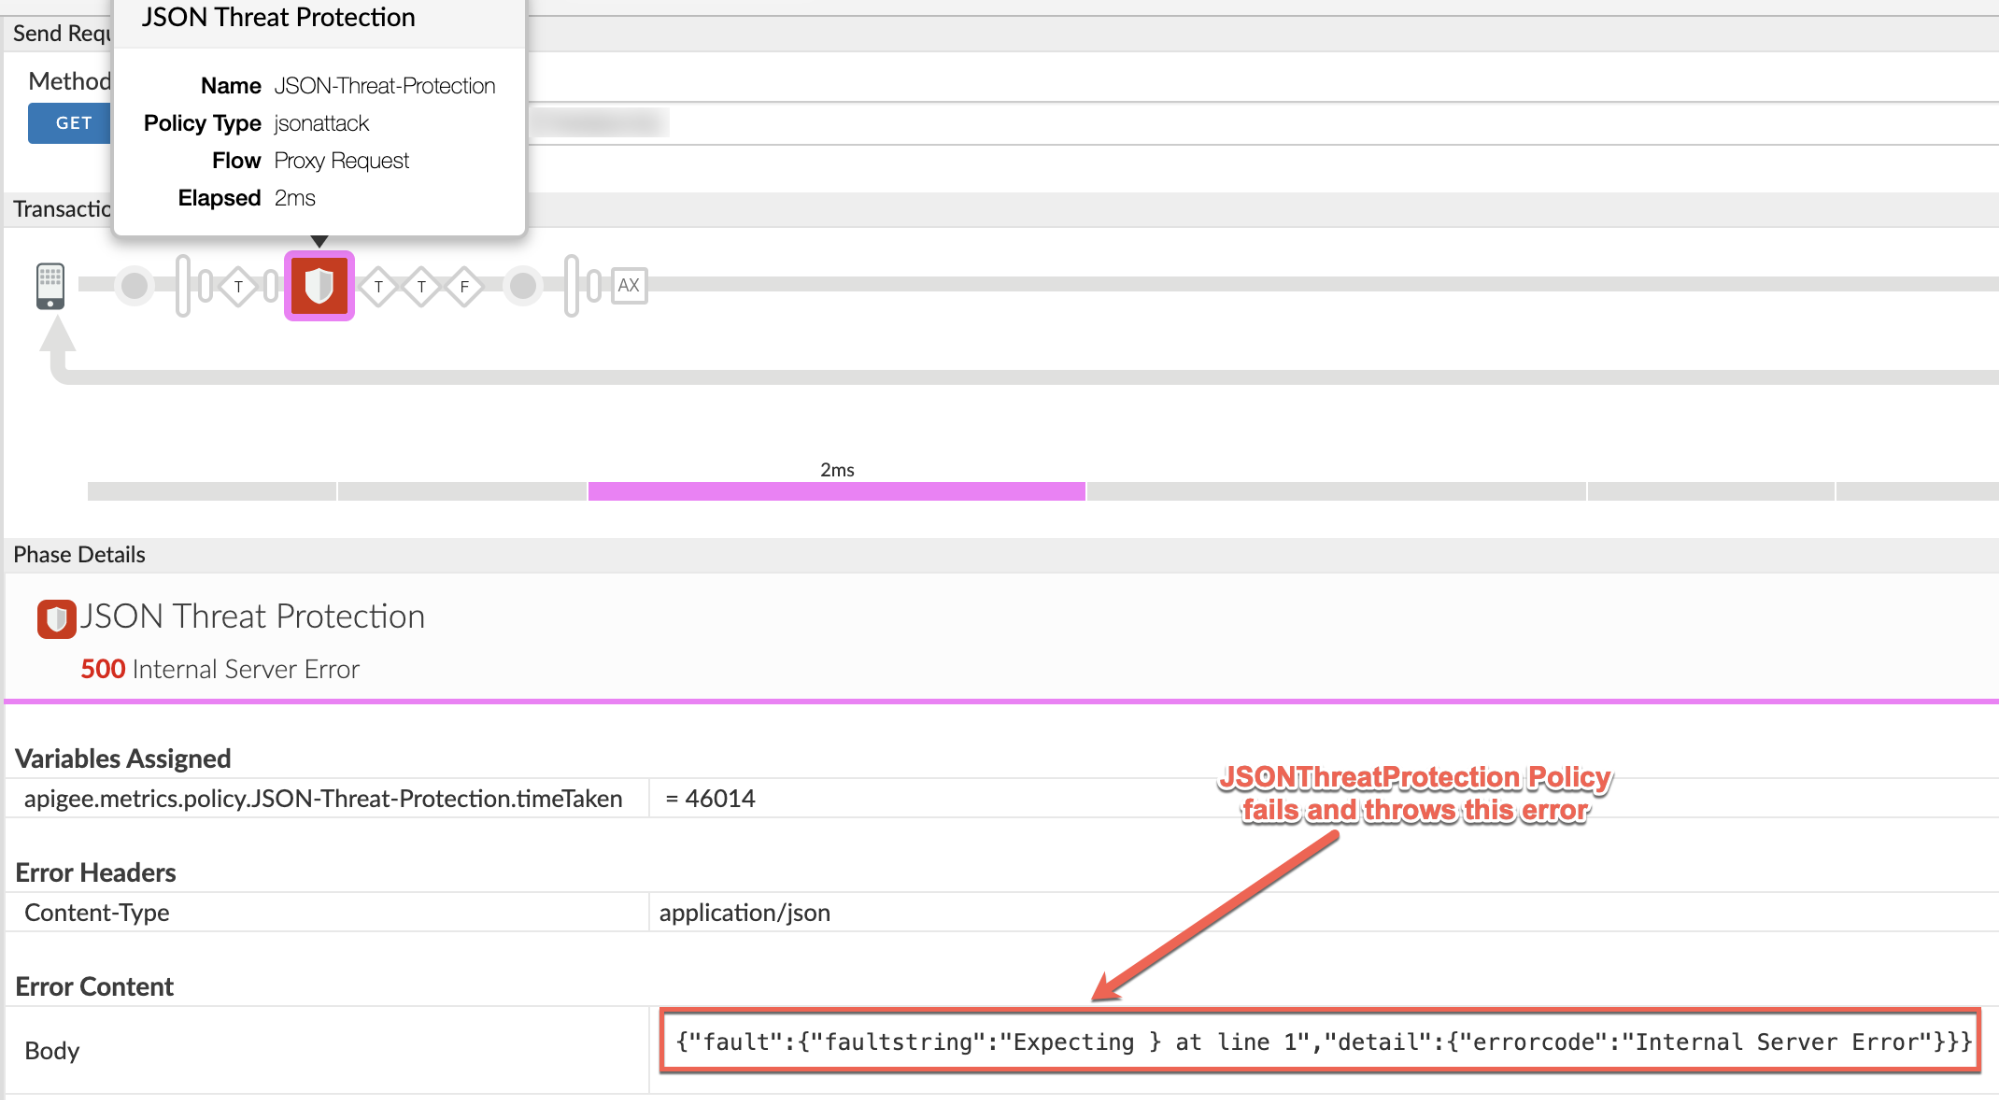
- Here’s a sample trace screenshot showing the JSONThreatProtection
policy failing with the error "Expecting } at line 1":

Make a note of the following information from the trace output, as shown in the above screenshot:
Failing Policy: JSONThreatProtection
Flow: Proxy Request
- Examine the failing policy definition and check the payload that is being parsed.
In the example scenario, examine the JSONThreatProtection policy named JSON-Threat-Protection that has failed and check the
<Source>element.<JSONThreatProtection async="false" continueOnError="false" enabled="true" name="JSON-Threat-Protection"> <DisplayName>JSON Threat Protection</DisplayName> <ArrayElementCount>20</ArrayElementCount> <ContainerDepth>10</ContainerDepth> <ObjectEntryCount>15</ObjectEntryCount> <ObjectEntryNameLength>50</ObjectEntryNameLength> <Source>request</Source> <StringValueLength>1000</StringValueLength> </JSONThreatProtection>
Notice that the
<Source>element points torequest.This means that the error occurred while parsing the request payload. - Determine the type of the payload being parsed by checking the API request.
- Validate if the payload is in the proper format. If the payload is not valid, then you can get this error.
If the payload is valid, but you are still getting errors as listed in the Error Messages section, then the cause for these errors is that the payload is being accessed when streaming is enabled.
Depending on the payload that is being parsed by the policy (as determined in step #6), examine the payload content in the Trace tool in the appropriate phase.
In the example scenario, the request payload is being parsed, so examine the "Request Received from Client" phase in the trace and check the Request Content.

If the Request Content is found to be empty as shown in the screenshot above, even though you have sent a valid payload, then that indicates that the likely cause of this issue is request streaming is enabled.
This is because when streaming is enabled, the request payload will not show up on the trace.
Similarly, if the response payload is being parsed when the error occurs, then check the response content in the "Response received from target server" phase.
Next, examine the Proxy and Target Endpoint definitions depending on where the failing policy is used in the API Proxy flow. Verify if streaming has been enabled.
In the example scenario, the failing policy was executed in the Proxy request flow (as determined in step #5 above); therefore, examine the Proxy Endpoint:
<ProxyEndpoint name="default"> ... <HTTPProxyConnection> <BasePath>/v1/weather</BasePath> <VirtualHost>secure</VirtualHost> <Properties> <Property name="response.streaming.enabled">true</Property> <Property name="request.streaming.enabled">true</Property> </Properties> </HTTPProxyConnection> </ProxyEndpoint>As seen in the example above, request streaming has been enabled as indicated by the property
"request.streaming.enabled"set to true.Therefore, the cause of the error is using the JSONThreatProtection policy in the API Proxy that accesses the request payload when streaming is enabled. This causes errors because it triggers buffering in the API Proxy and defeats the purpose of using streaming in Apigee Edge.
This error may not be seen with smaller payloads, but when you use larger payloads, you can see these errors.
- You can verify that the 500 error is caused due to the policy by checking the value
of "X-Apigee-fault-source" in the "AX"
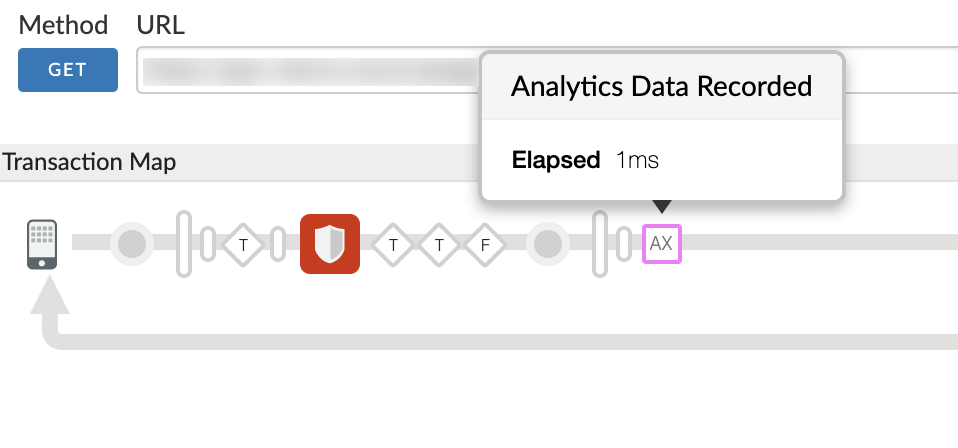
(Analytics Data Recorded) Phase in the trace using the steps given below:
- Click on "AX" (Analytics Data Recorded) Phase
as shown in the screenshot below:

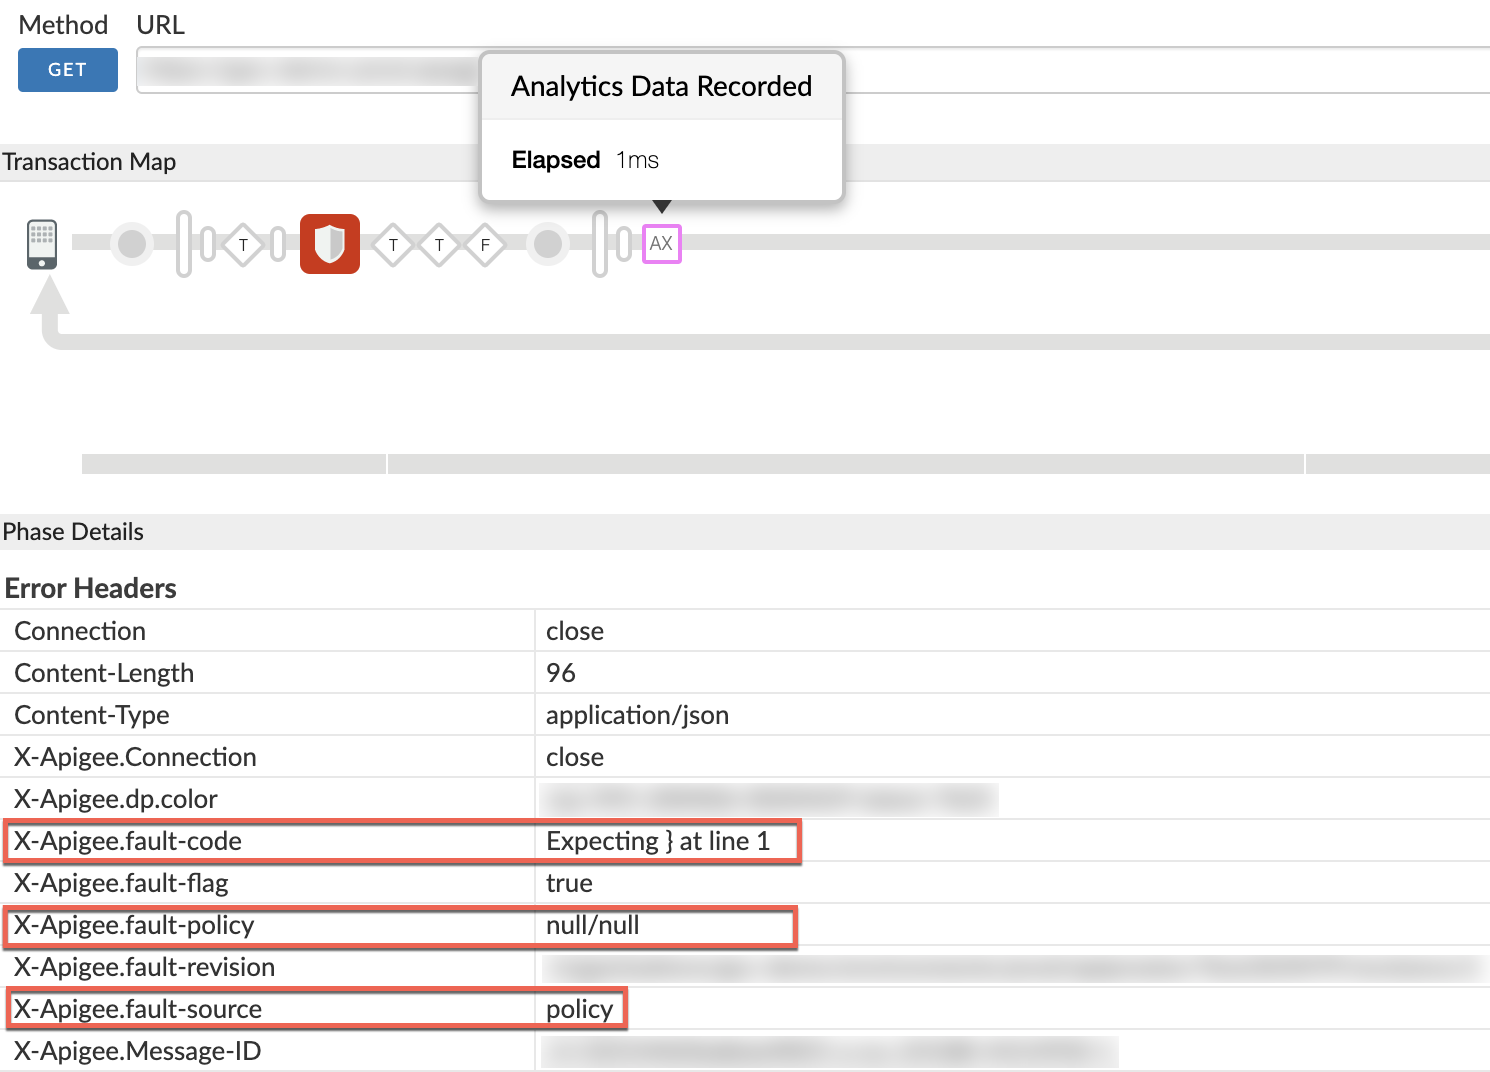
- Scroll down the Phase Details to the "Error Headers" section and
determine the values of "X-Apigee-fault-code",
"X-Apigee-fault-source" and "X-Apigee-fault-policy" as shown below:

- If the value of "X-Apigee-fault-source" is "policy" as shown in the picture above, then it indicates that the error is caused due to policy accessing the payload when streaming is enabled.
- Click on "AX" (Analytics Data Recorded) Phase
as shown in the screenshot below:
You can check the content of the request payload and Content-Type header in
the API request. In the following example curl command, a JSON payload is used.
curl -i https://VIRTUAL_HOST_ALIAS/BASEPATH -H "Content-Type: application/json" \
-X POST -d @request-payload.json
You could also check the policy that is failing and determine the type of the payload being parsed. In the example scenario above, the JSON-Threat-Protection policy is failing. This indicates that the payload must be in JSON format.
Resolution
Accessing payload with streaming enabled is an antipattern as explained in Antipattern: Access the request/response payload when streaming is enabled.
- If you want to process the payload, then you need to disable streaming in the Proxy/Target
Endpoint by removing the properties
"request.streaming.enabled" and
  "response.streaming.enabled"
as shown in the example ProxyEndpoint below:<ProxyEndpoint name="default"> ... <HTTPProxyConnection> <BasePath>/v1/weather</BasePath> <VirtualHost>secure</VirtualHost> </HTTPProxyConnection> </ProxyEndpoint>OR
- If you want to use streaming for your API Proxy(ies), then do not use any policies in the API Proxy that access the request/response payload.
Note:
- In this playbook, JSONThreatProtection policy was used to process the request payload with streaming enabled in the example scenario. This led to 500 Internal Server Error with different errors.
- These errors can also be seen with policies such as JSONToXML and XMLToJSON, which process request or response payloads when streaming is enabled.
- We strongly recommend not to use any such policies in proxies that require access to payloads when streaming is enabled.
- Doing so is an antipattern, as documented in Antipattern: Access the request/response payload when streaming is enabled.
Diagnose Issues using API Monitoring
If you are a Private Cloud user, skip this procedure.
API Monitoring enables you to isolate problem areas quickly to diagnose error, performance, and latency issues and their source, such as developer apps, API proxies, backend targets, or the API platform.
Step through a sample scenario that demonstrates how to troubleshoot 5xx issues with your APIs using API Monitoring. For example, you may want to set up an alert to be notified when the number of 500 Errors exceed a particular threshold.
If you want to get notified when a 500 error response is thrown from policy, then you need to set up the alert for 500 status code with the fault source as Proxy.
Must Gather Diagnostic Information
If the problem persists even after following the above instructions, please gather the following diagnostic information. Contact and share them to Apigee Support.
If you are a Public Cloud user, provide the following information:
- Organization Name
- Environment Name
- API Proxy Name
- Complete curl command along with request payload (if any) to reproduce the 500 error
- Trace file containing the requests with 500 Internal Server Error
- If the 500 errors are not occurring currently then provide the time period with the timezone information when 500 errors occurred in the past.
If you are a Private Cloud user, provide the following information:
- Complete error message observed for the failing requests
- Organization, Environment Name and API Proxy Name for which you are observing 500 errors
- API Proxy Bundle
- Payload used in the request (if any)
- Trace file containing the requests with 500 Internal Server Error
- NGINX access logs (
/opt/apigee/var/log/edge-router/nginx/ <org>~ <env>.<port#>_access_log) - Message Processor logs (
/opt/apigee/var/log/edge-message-processor/logs/system.log) - The time period with the timezone information when the 500 errors occurred.
