
You're viewing Apigee Edge documentation.
Go to the
Apigee X documentation. info
On Wednesday, January 23, 2019 we began releasing a new version of Apigee API Monitoring for Public Cloud.
See About release numbering to understand how you can figure it out by comparing release numbers.
Questions or issues? Contact Apigee Edge Support.
Release notifications: Go to http://status.apigee.com and click Subscribe to Updates.
New Features
The following new features were added to this release.
Log page now shows results for the time filters specified on the Latency dashboard
If you filter data in the Latency dashboard by a specific time and duration, and then open the logs from the Latency dashboard, the logs are now shown for the same time and duration filter. See Use the Latency dashboard for more.
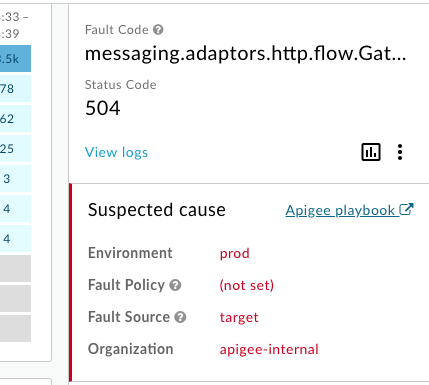
Added playbook link to fault code docs
This release includes a new Apigee playbook link in the metrics details panel of the Investigate dashboard. This link appears only when additional information about the fault code is available. Click the link to view additional information, as shown below:
Bugs Fixed
The following bugs are fixed in this release. This list is primarily for users checking to see if their support tickets have been fixed. It's not designed to provide detailed information for all users.
| Issue ID | Description |
|---|---|
| 120293328, 122689236 |
Show response time in milliseconds in logs panel When viewing metric details for either status codes or latency, the response time is now shown in milliseconds, instead of seconds. |
| 120294071 |
Standardize on using "Status Code" in the UI The API Monitoring UI used various terms to describe an HTTP status (HTTP Status, Response Status, Status Code, Code, Status). The UI has now standardized on using "Status Code". |
| 122670932 |
Can now reselect All Proxies and Top 10 proxies on Investigate page On the Investigate page, if you selected a value other than All (Status Code page) or Top 10 (Latency page) in the drop-down, you could not reselect it. |
| 122689236 |
Response time in log panel details now shows time in milliseconds On expanding logs inside the log panel, response time is now displayed in milliseconds instead of seconds. |
| 122689990 |
Removed option to view logs for Targets on the Latency page API Monitoring does not record target log data. Therefore, the view logs options has been removed for Targets on the Latency page. |
| 122690287 |
Create correct filters on custom reports generated from the Latency page API Monitoring now generates correct filters on custom reports generated from the Latency page. |
| 122742708 |
UI now updates correctly when switching between Status Code and Latency views on Investigate page |
| 122742852 |
Region filter now set correctly when switching between Status Code and Latency views on Investigate page |